


PI has recorded a modest 1% gain in the past 24 hours, mirroring the broader market rally during that period.
However, despite this short-term uptick, key technical indicators suggest that the token remains under significant bearish pressure, with further losses on the horizon.
PI’s Buying Pressure Fades as Bearish Signals Dominate
PI’s Chaikin Money Flow (CMF) has maintained a downward trend since March 14, reflecting the weak buying activity among market participants. At press time, the indicator, which tracks how money flows into and out of an asset, is below zero at -0.21.
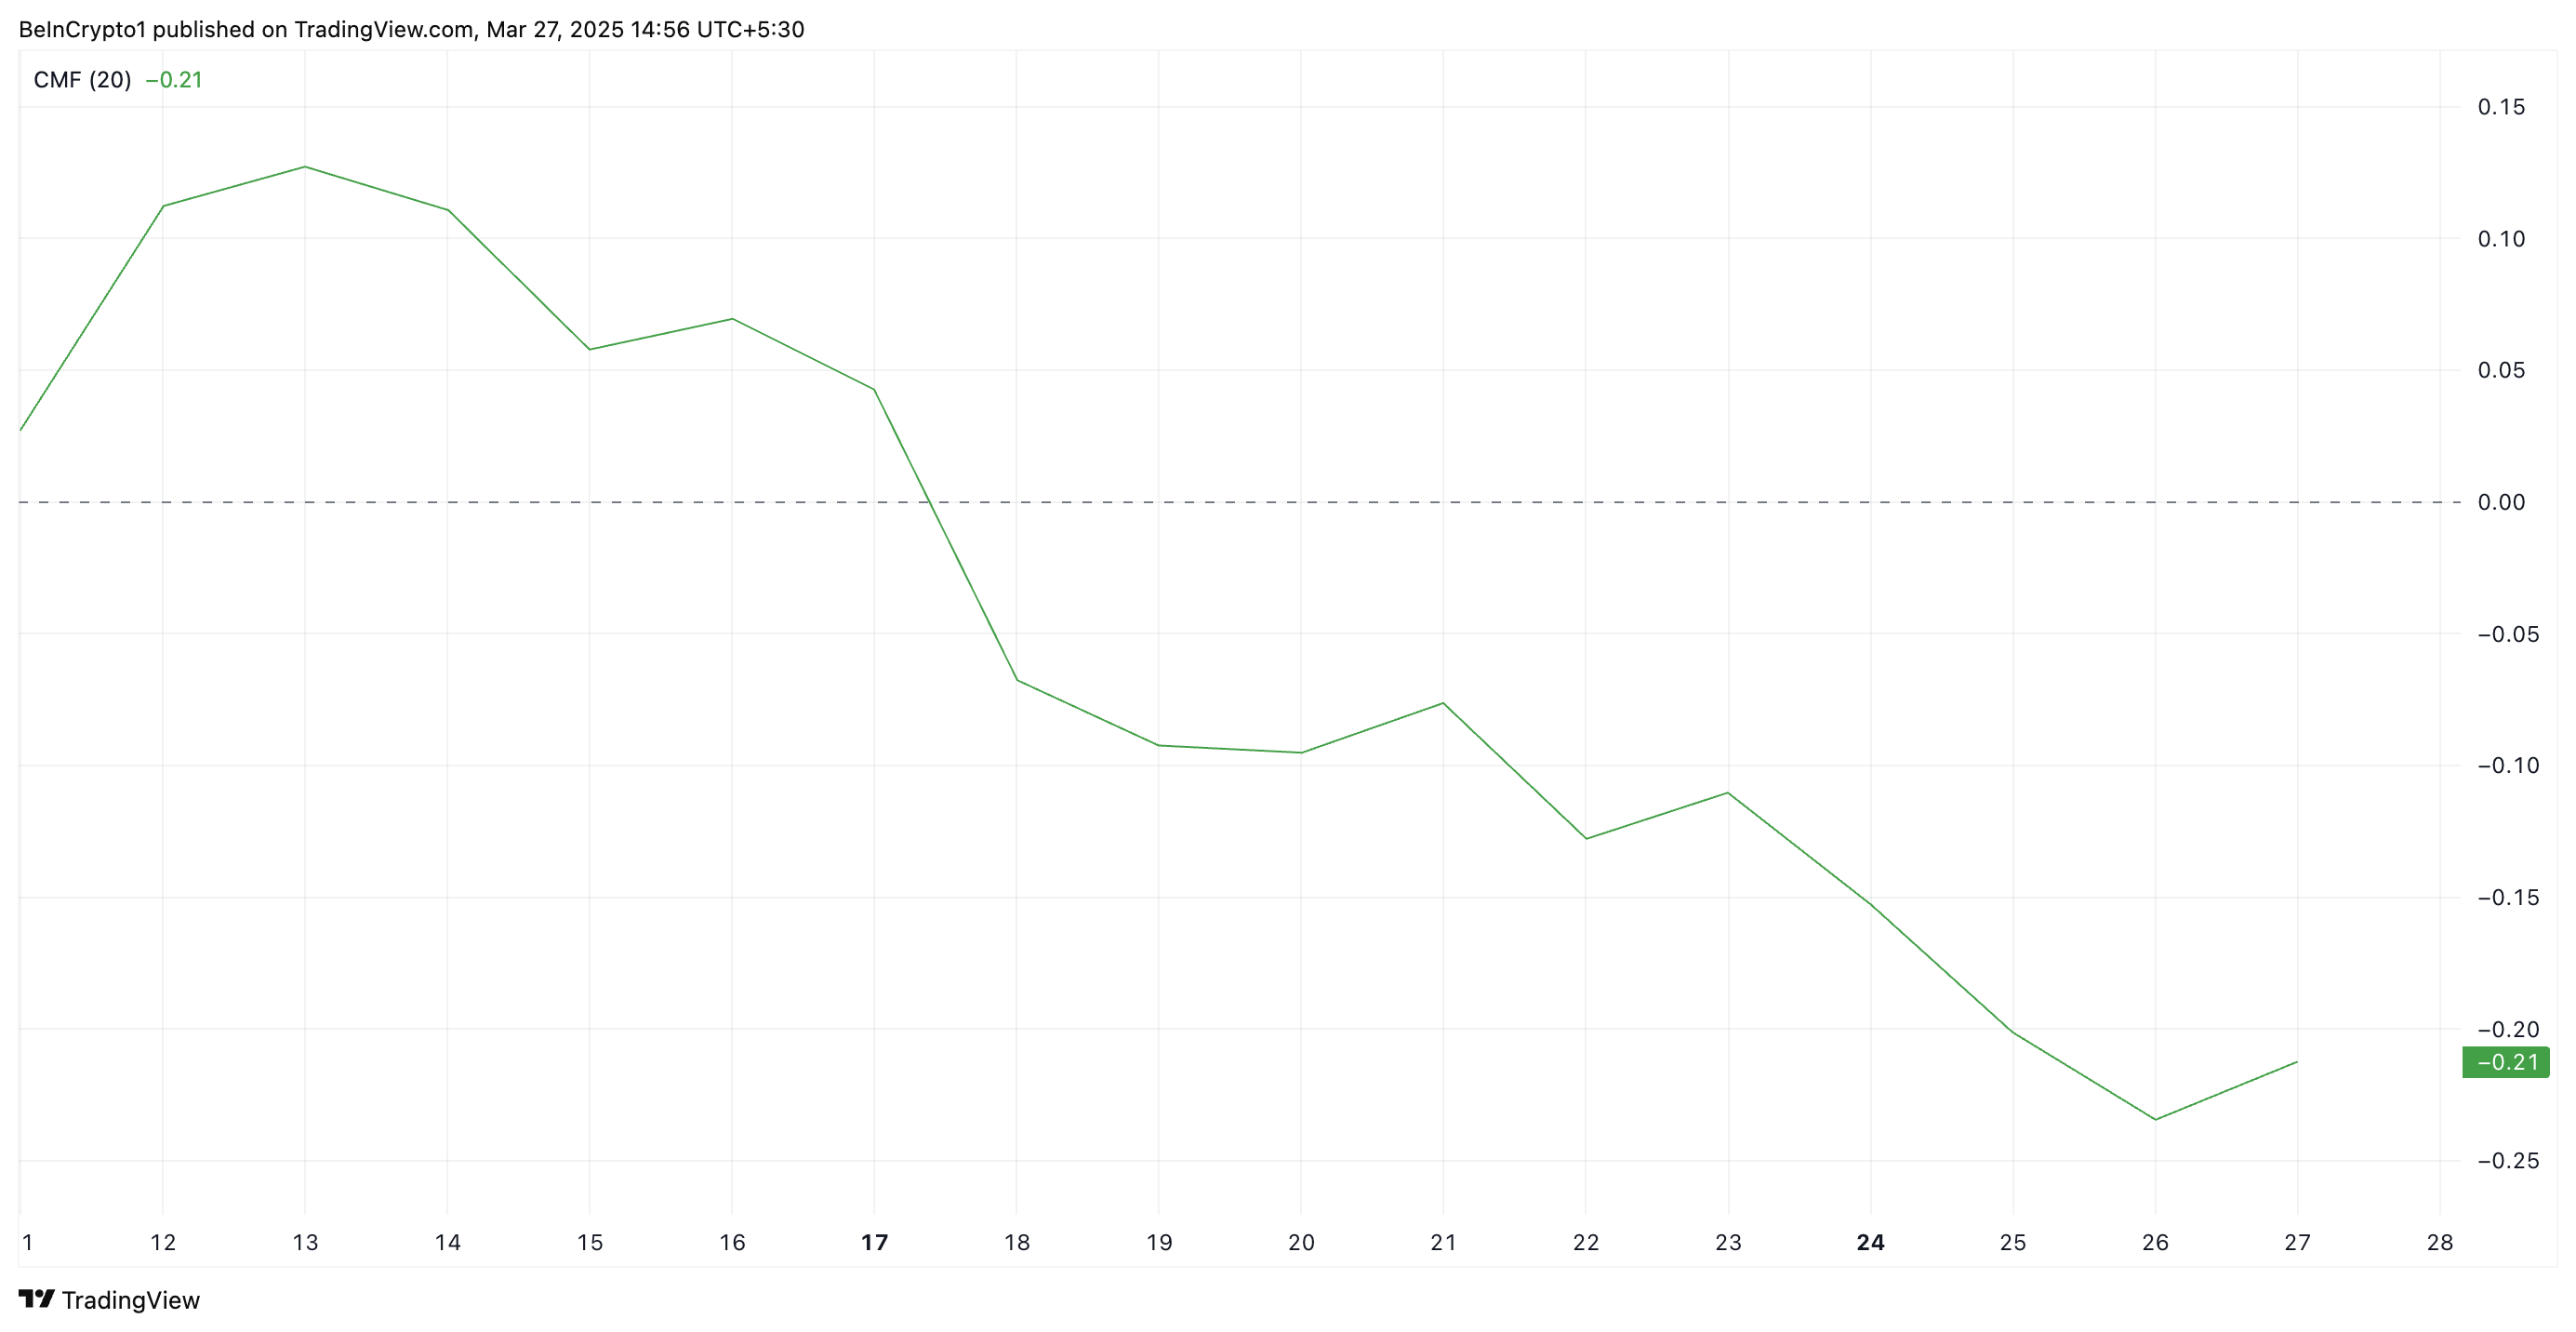
When an asset’s CMF declines and falls below zero, it signals weakening buying pressure and increasing selling momentum. It indicates that capital is flowing out of PI as traders intensify profit-taking efforts, exacerbating its price decline.
The sustained drop below zero reinforces this bearish outlook and hints at further price declines as long as PI sellers remain dominant.
Further, PI’s Awesome Oscillator (AO) has returned a red histogram bar, with its value at -0.60. The indicator tracks short- and long-term moving averages to confirm or deny market trends. It helps traders assess whether bullish or bearish momentum is strengthening or weakening.
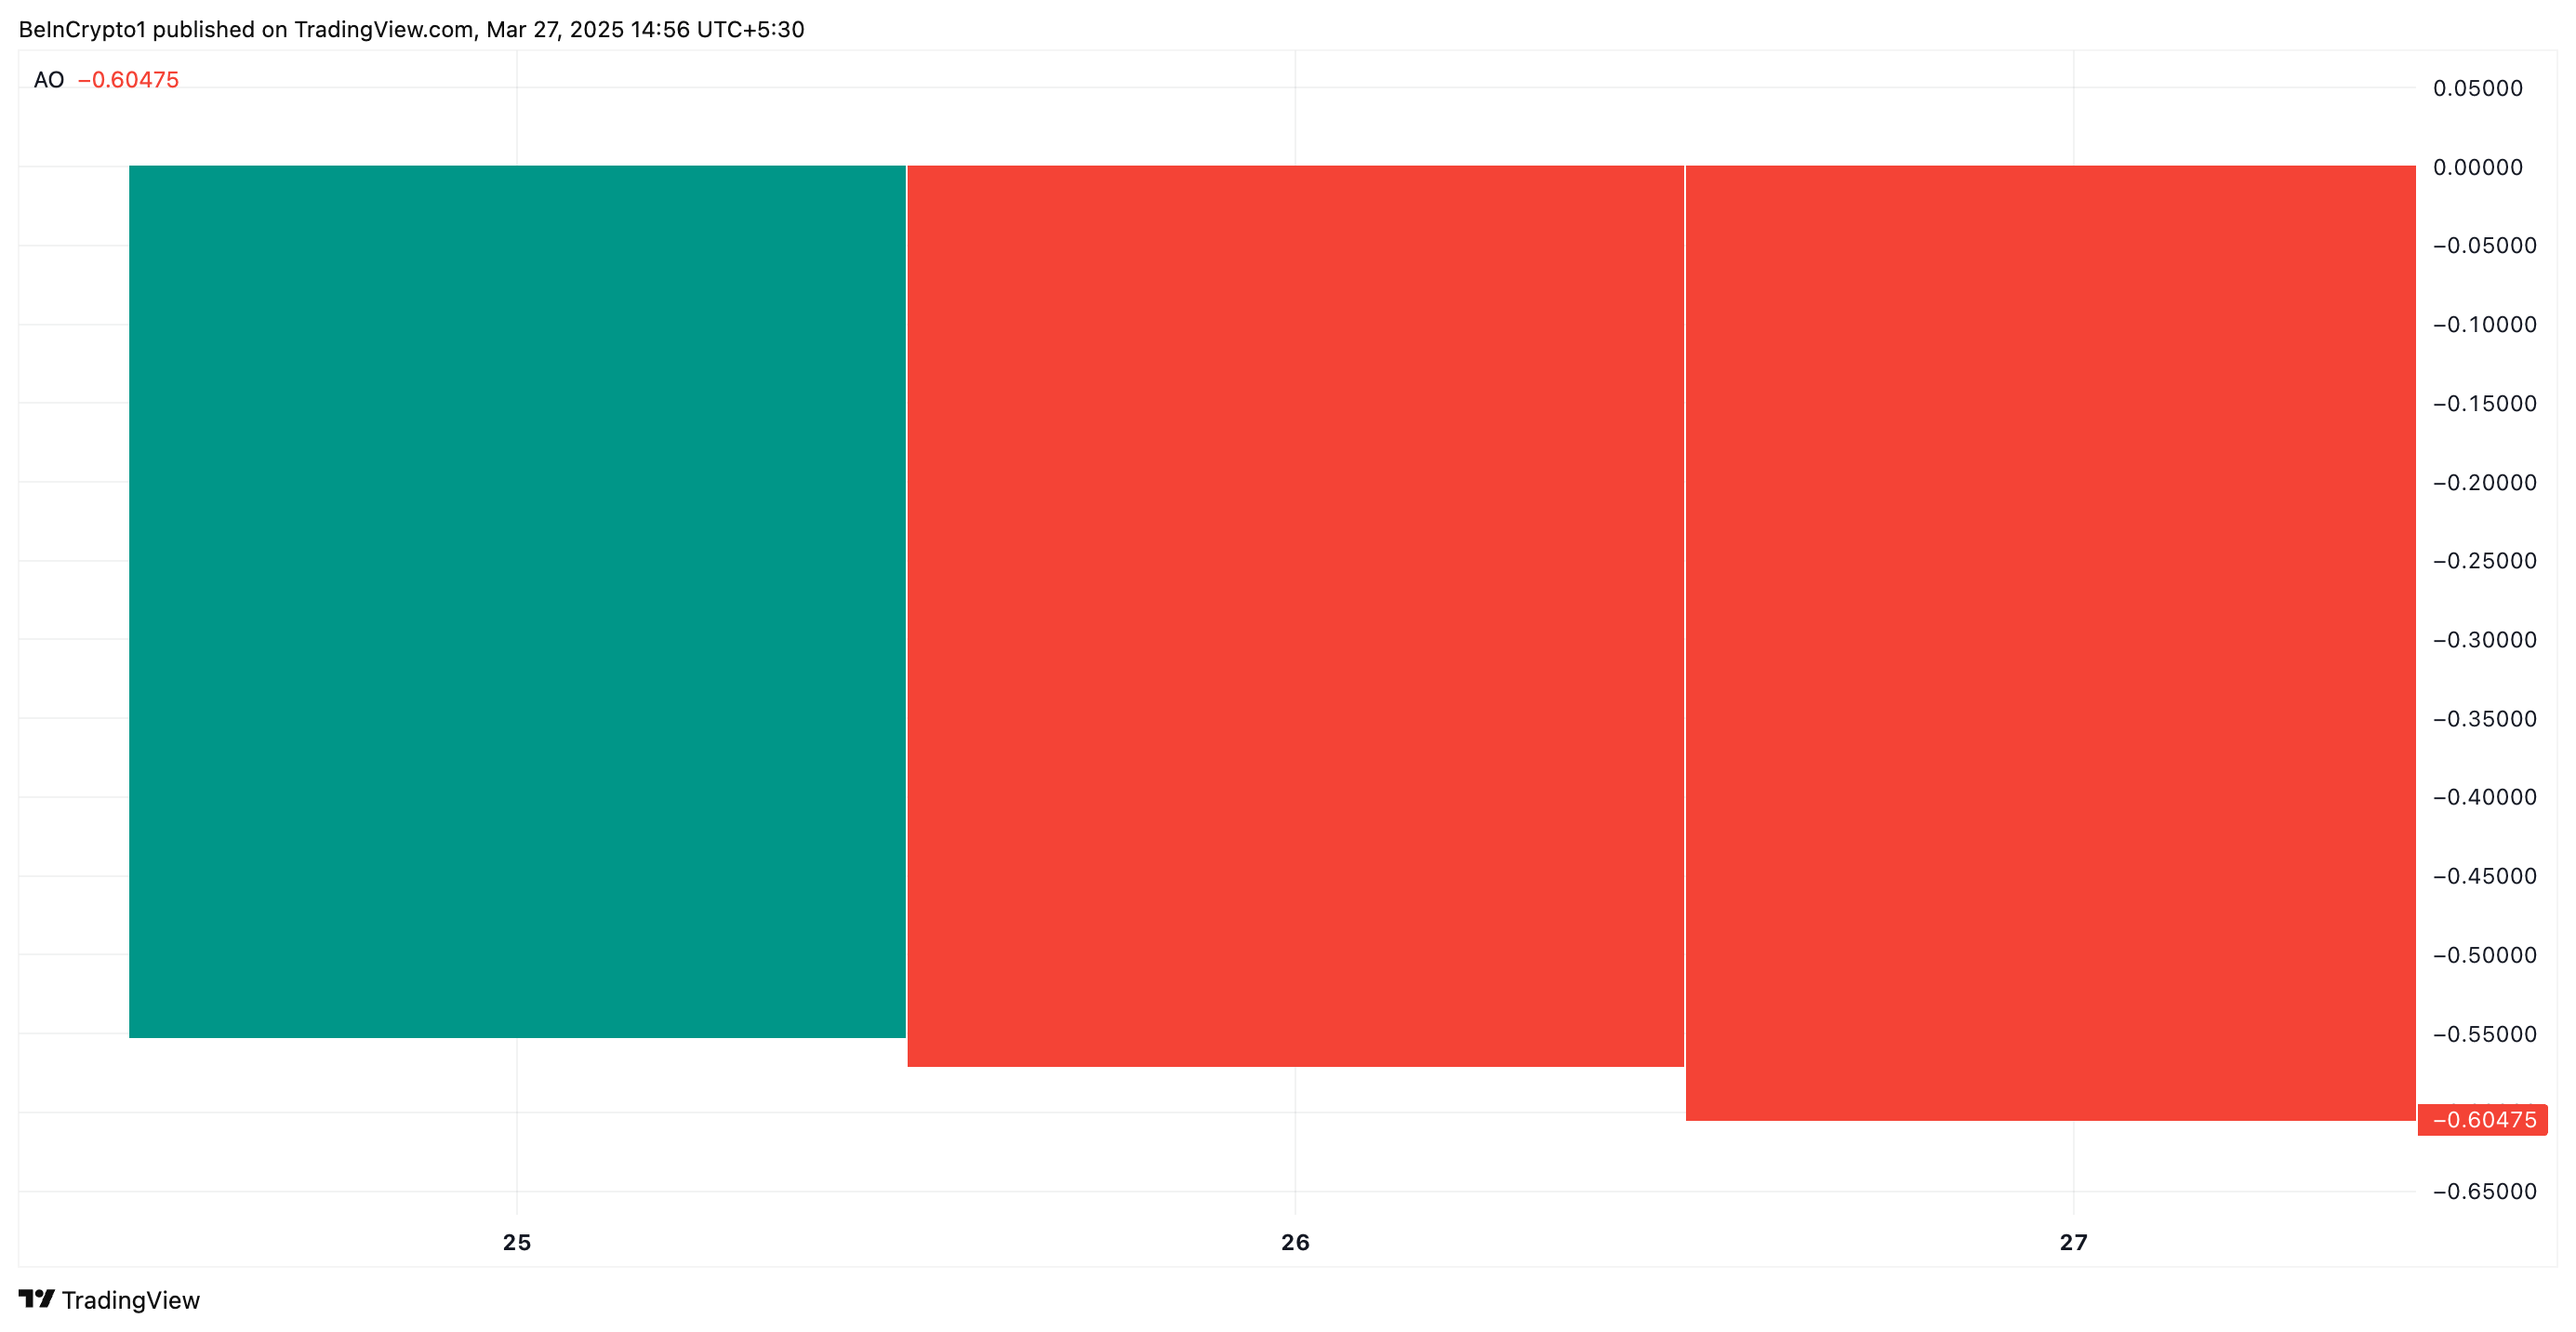
When the AO returns a red bar, the current histogram value is lower than the previous one, signaling an increase in bearish pressure. Traders use this as an early warning to exit long positions or prepare for a possible market reversal.
Multiple red bars are starting to appear consecutively on the PI/USD one-day chart, indicating that the buying strength in its spot markets is fading fast.
PI at Make-or-Break Level—Will It Plunge to $0.62?
PI continues to trade within its descending parallel channel as sellers strengthen their control. At press time, PI trades at $0.85, near the lower trend line of this channel, which forms a key support floor.
The channel emerges when an asset’s price moves between two downward-sloping parallel trendlines, indicating a sustained bearish trend. If the price is poised to break below the lower trendline, it signals intensified selling pressure and an acceleration of the downtrend, which could lead to further losses.
If PI breaks below this support floor, it would add more downward pressure on its price and could force it to drop to $0.62.
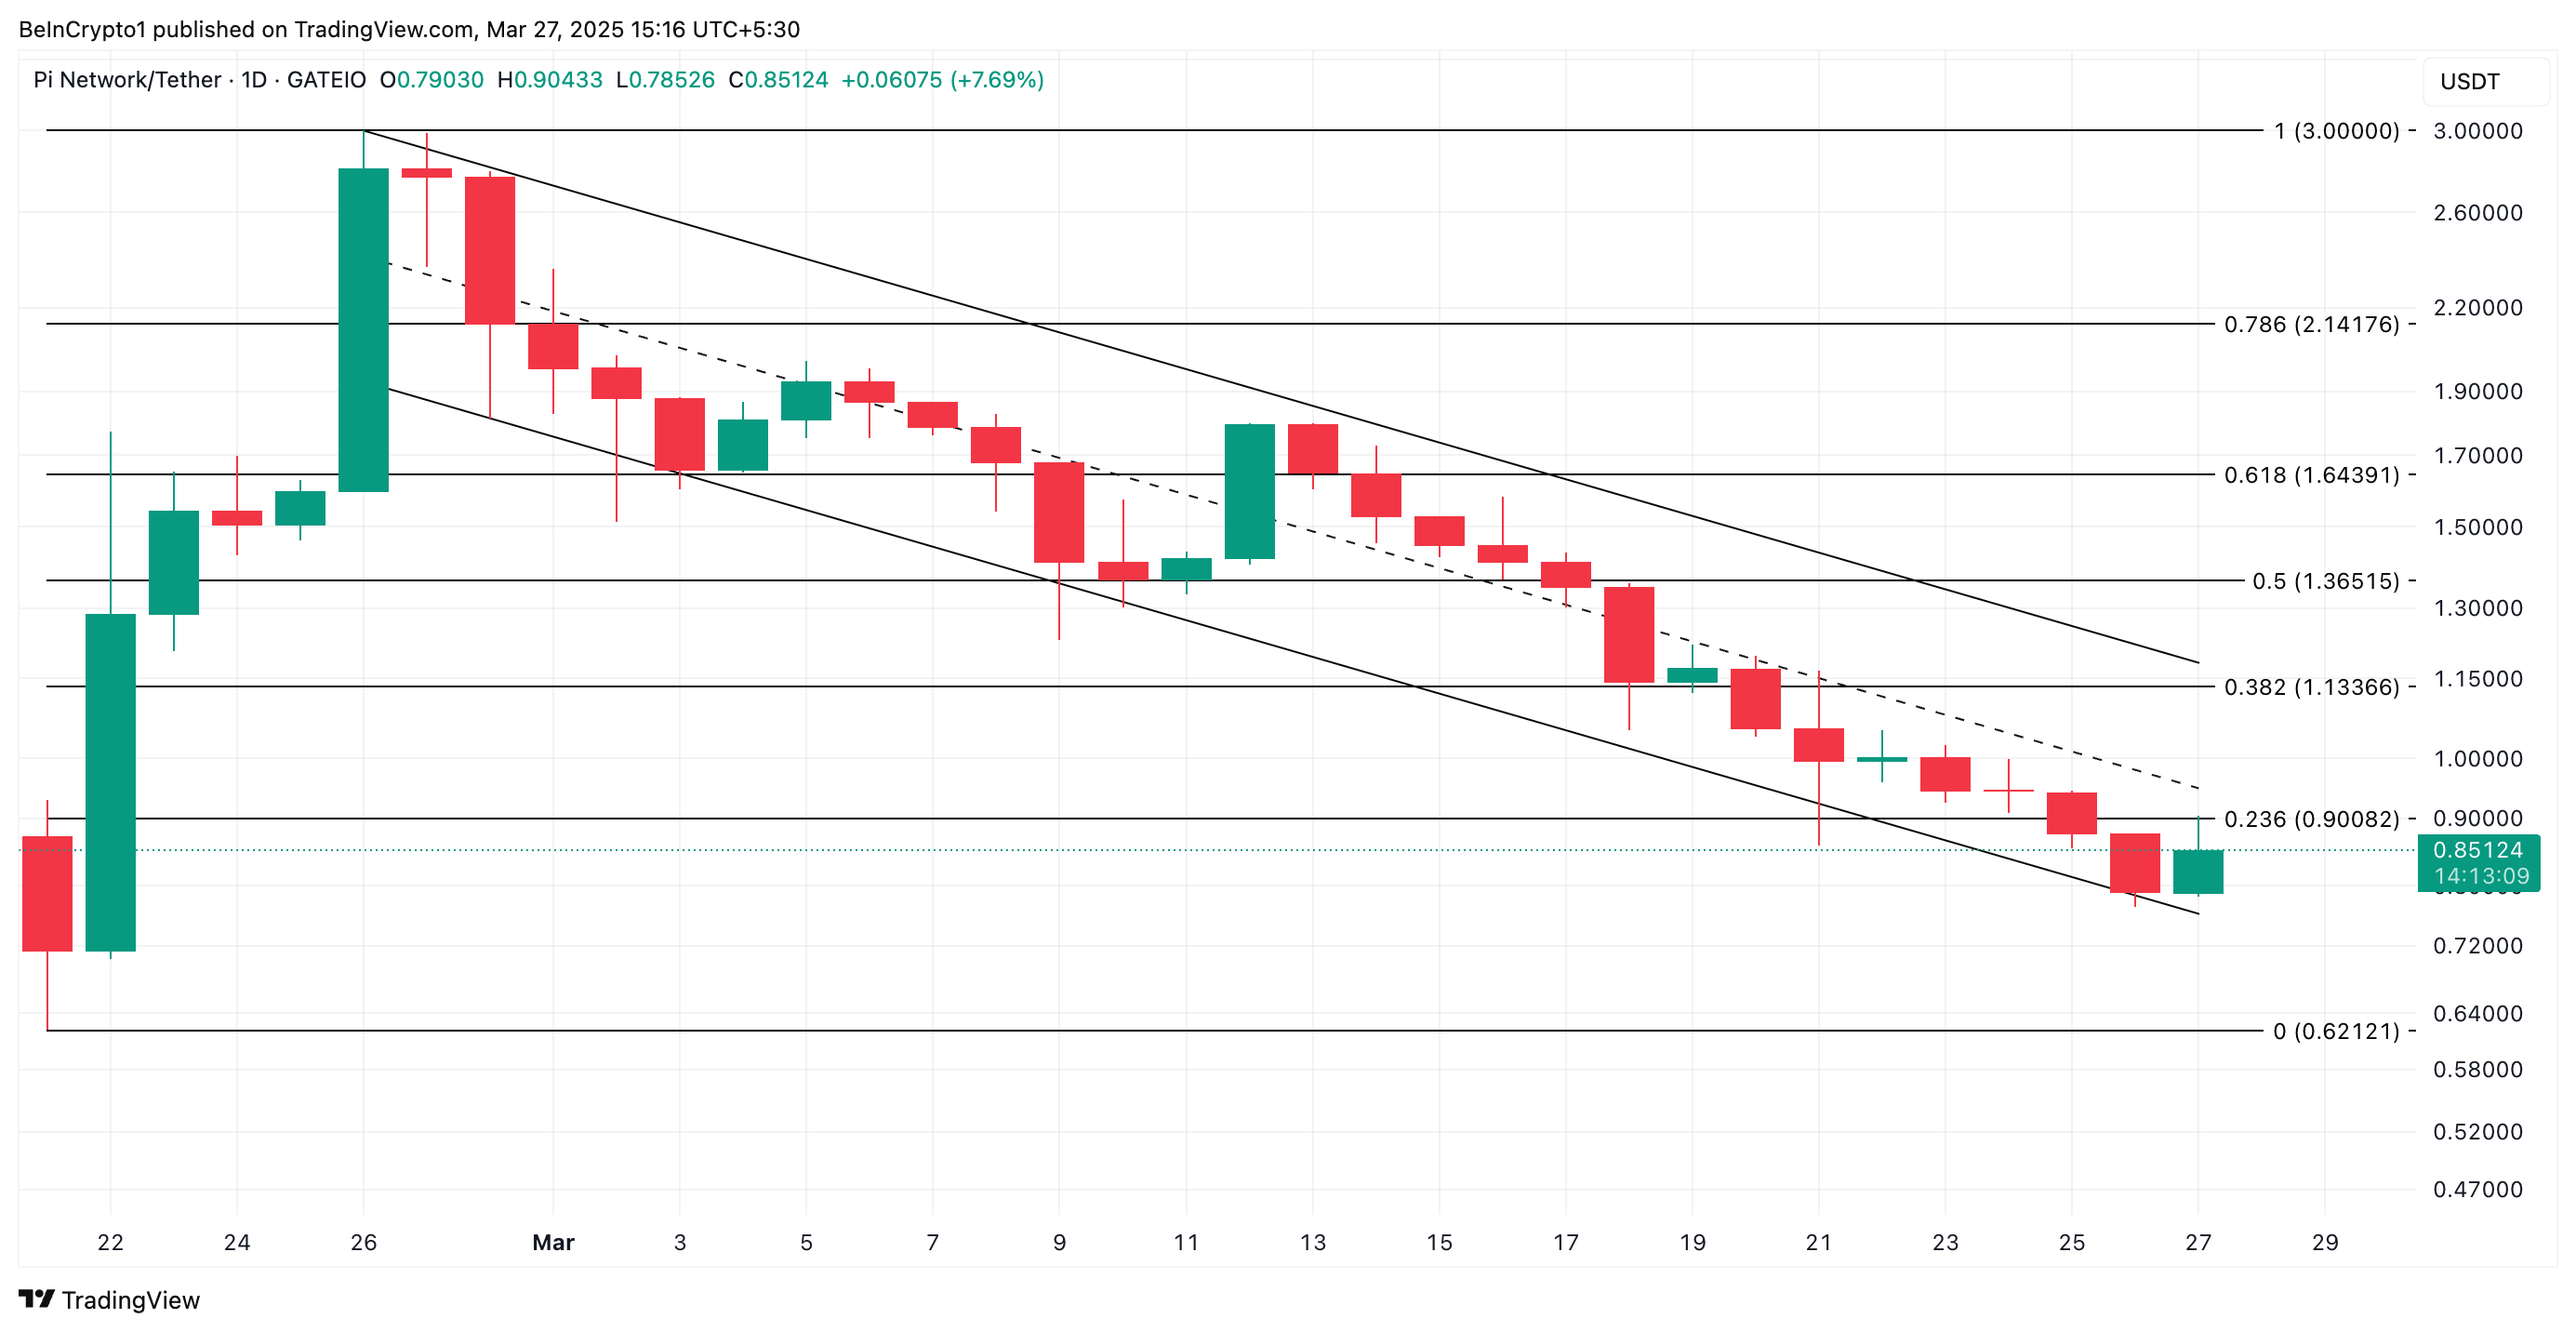
On the other hand, a bullish trend reversal would prevent this. If PI demand soars, its price could rally past $0.90.
Disclaimer
In line with the Trust Project guidelines, this price analysis article is for informational purposes only and should not be considered financial or investment advice. BeInCrypto is committed to accurate, unbiased reporting, but market conditions are subject to change without notice. Always conduct your own research and consult with a professional before making any financial decisions. Please note that our Terms and Conditions, Privacy Policy, and Disclaimers have been updated.