

 Turns Bullish as Bearish Pressure Eases")
Hedera (HBAR) is up over 6% in the last 24 hours as it tries to reclaim the $8 billion market cap. Its trading volume has jumped 19% to nearly $176 million, showing renewed interest.
Key indicators are mixed. The BBTrend remains bearish, but RSI and EMA lines suggest rising bullish momentum. A golden cross may soon form, and HBAR is nearing key resistance levels. Its next move could confirm whether a breakout or a pullback is coming.
Hedera BBTrend Remains Negative—Is the Worst Over?
Hedera’s BBTrend indicator is currently at -1.56 and has remained in negative territory since May 1. It hit a low of -6.76 yesterday, marking the most bearish reading in over a month before bouncing slightly today.
This ongoing negative trend suggests that downward momentum has dominated the market, even as short-term selling pressure shows signs of easing.
The BBTrend, or Bollinger Band Trend indicator, measures price positioning relative to Bollinger Bands to determine a trend’s strength and direction.
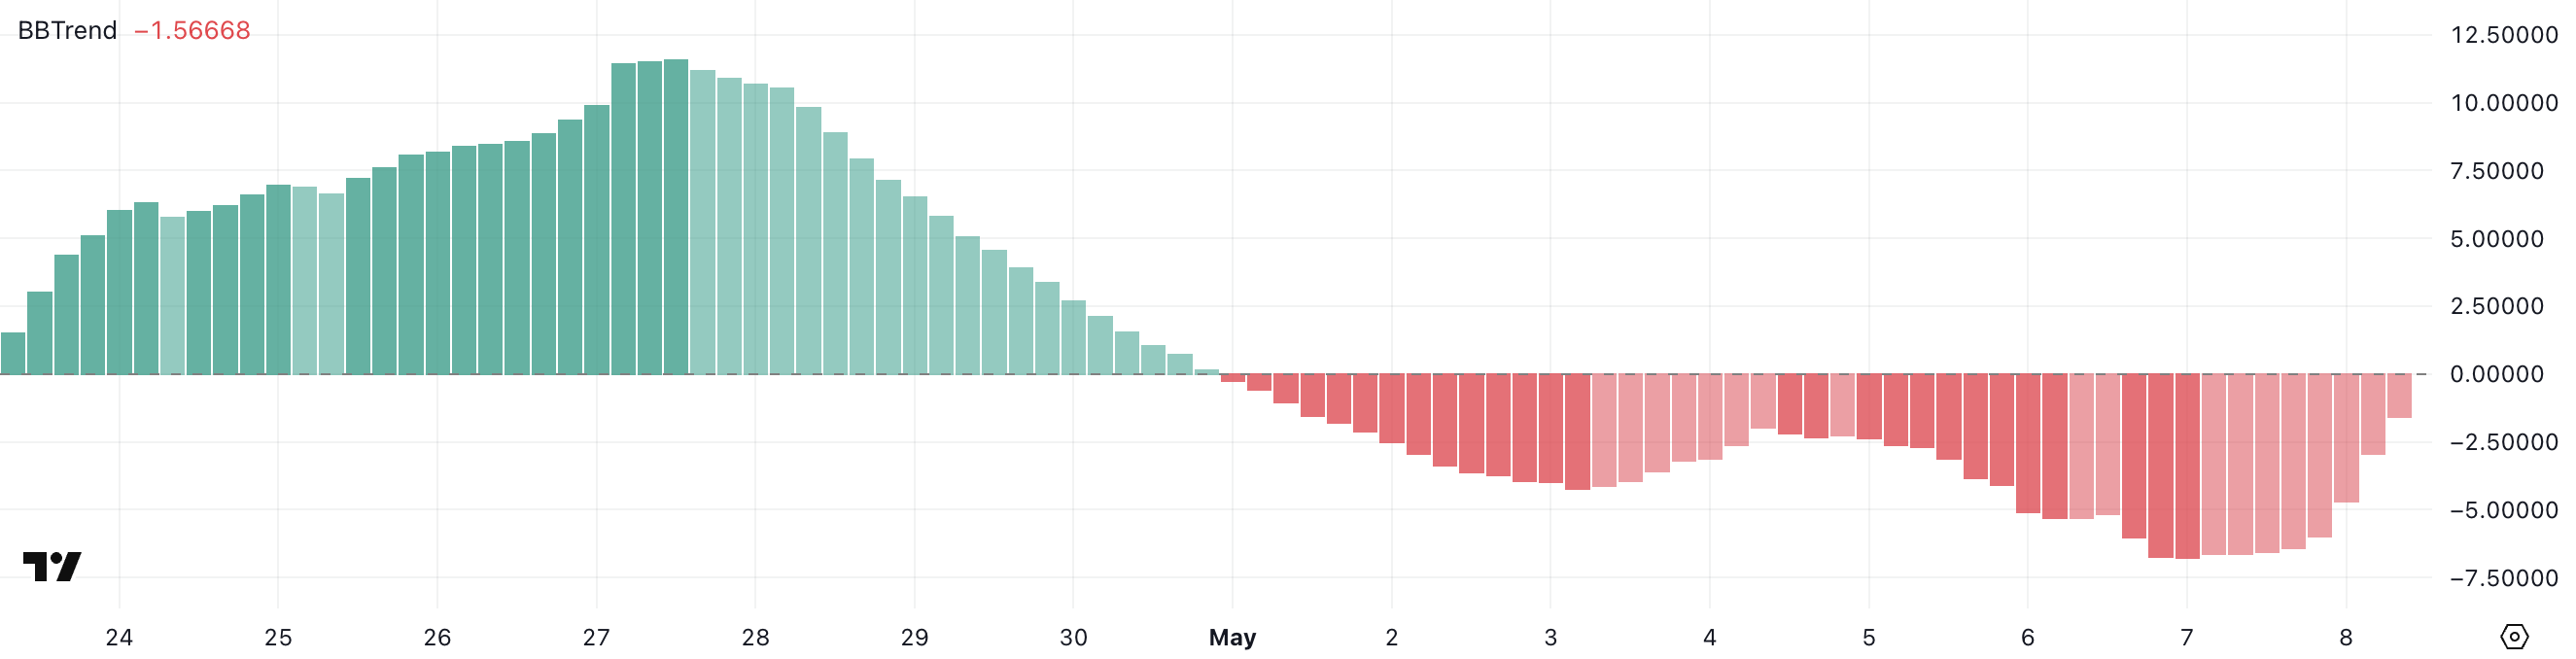
Values above +1 suggest strong bullish momentum, while readings below -1 indicate strong bearish conditions. A neutral range between -1 and +1 often reflects consolidation or weak trend conviction.
With HBAR’s BBTrend at -1.56, it remains bearish territory, though the uptick from yesterday’s extreme suggests that the selloff may be losing steam.
If the BBTrend continues to rise and crosses above -1, it could signal a shift toward price recovery or at least a pause in the downtrend.
Hedera Approaches Overbought Zone After Strong Rebound
Hedera Relative Strength Index (RSI) has surged to 66.2, up sharply from 31.41 just two days ago.
This rapid rise reflects a strong shift in momentum, taking HBAR from oversold conditions into a zone that signals growing bullish pressure.
Such a move often indicates buyers are stepping in aggressively, reversing recent weakness and potentially setting the stage for a short-term breakout if the trend continues.
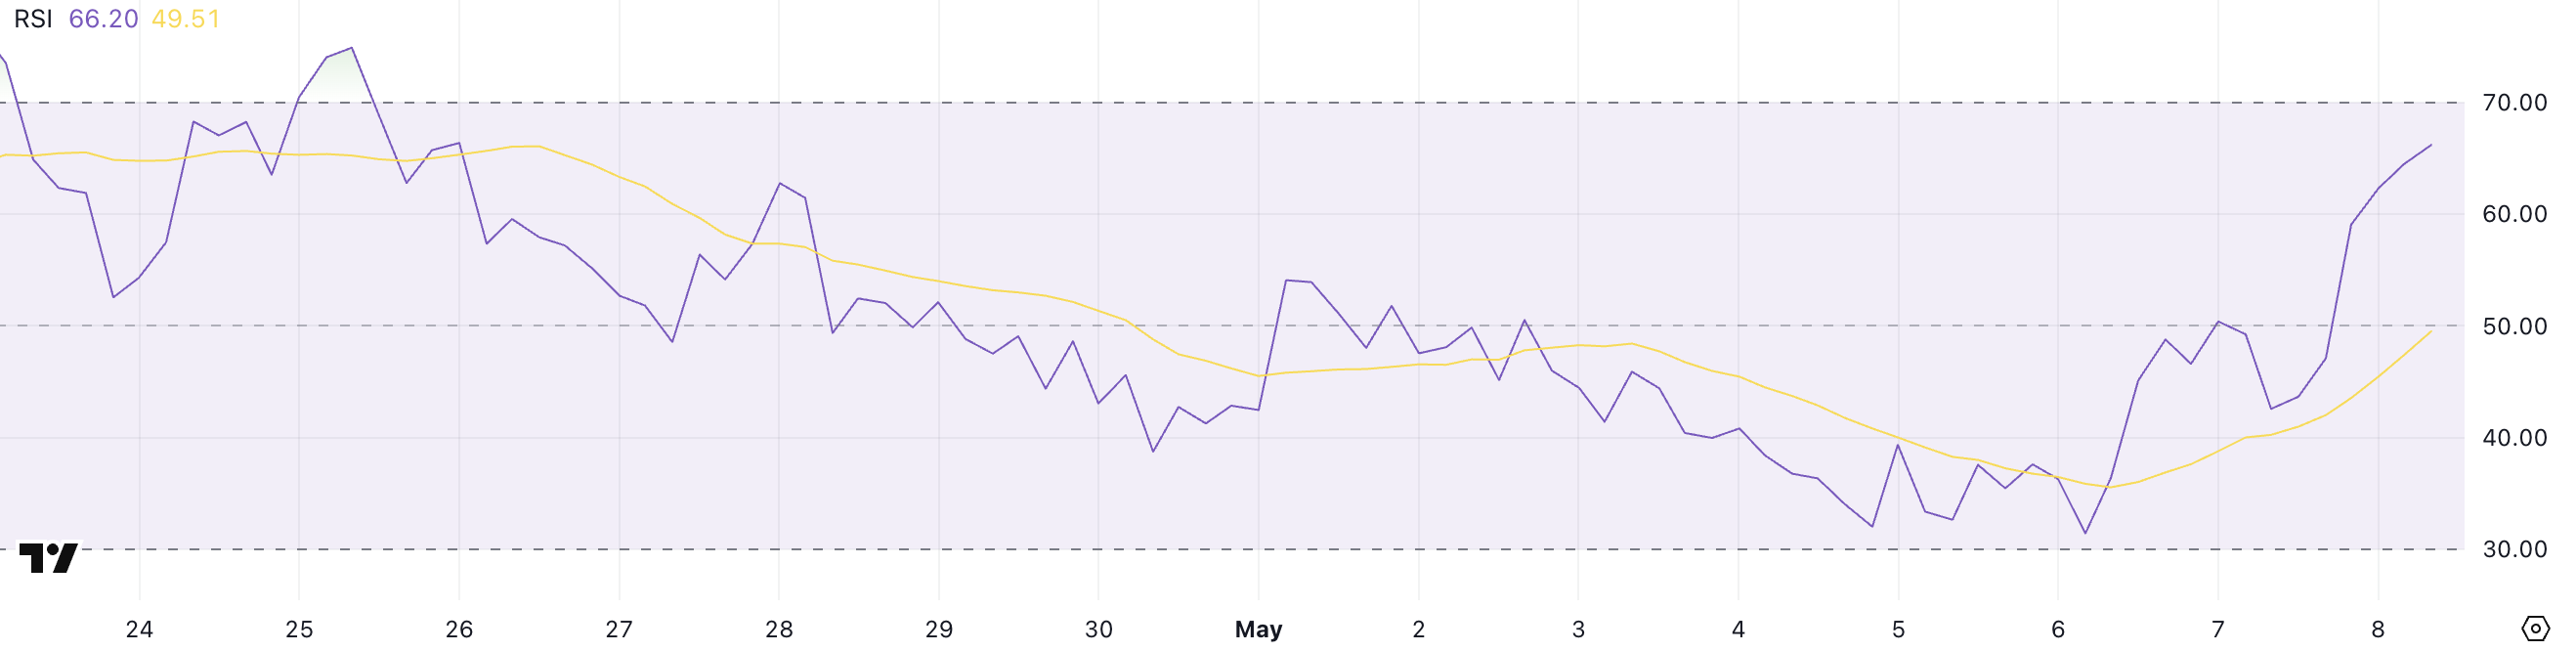
The RSI is a common momentum indicator that ranges from 0 to 100. Readings below 30 suggest oversold conditions and a potential rebound. Values above 70 indicate the asset may be overbought and due for a pullback.
Readings between 50 and 70 show growing strength in an uptrend. HBAR’s RSI is now at 66.2—close to overbought, but not there yet. This signals more upside potential if momentum continues.
However, traders should watch for any signs of exhaustion if RSI crosses 70 in the coming sessions.
HBAR Next Move: 38% Rally or 33% Correction Ahead?
Hedera EMA lines are tightening, and a golden cross could be on the horizon as short-term moving averages approach a crossover above long-term ones.
This setup is typically seen as bullish, suggesting upward momentum may soon strengthen. If the golden cross confirms and Hedera price breaks above the $0.191 and $0.199 resistance levels, the next targets could be $0.215 and $0.258.
A rally to those levels would represent a potential 38% upside from current prices.
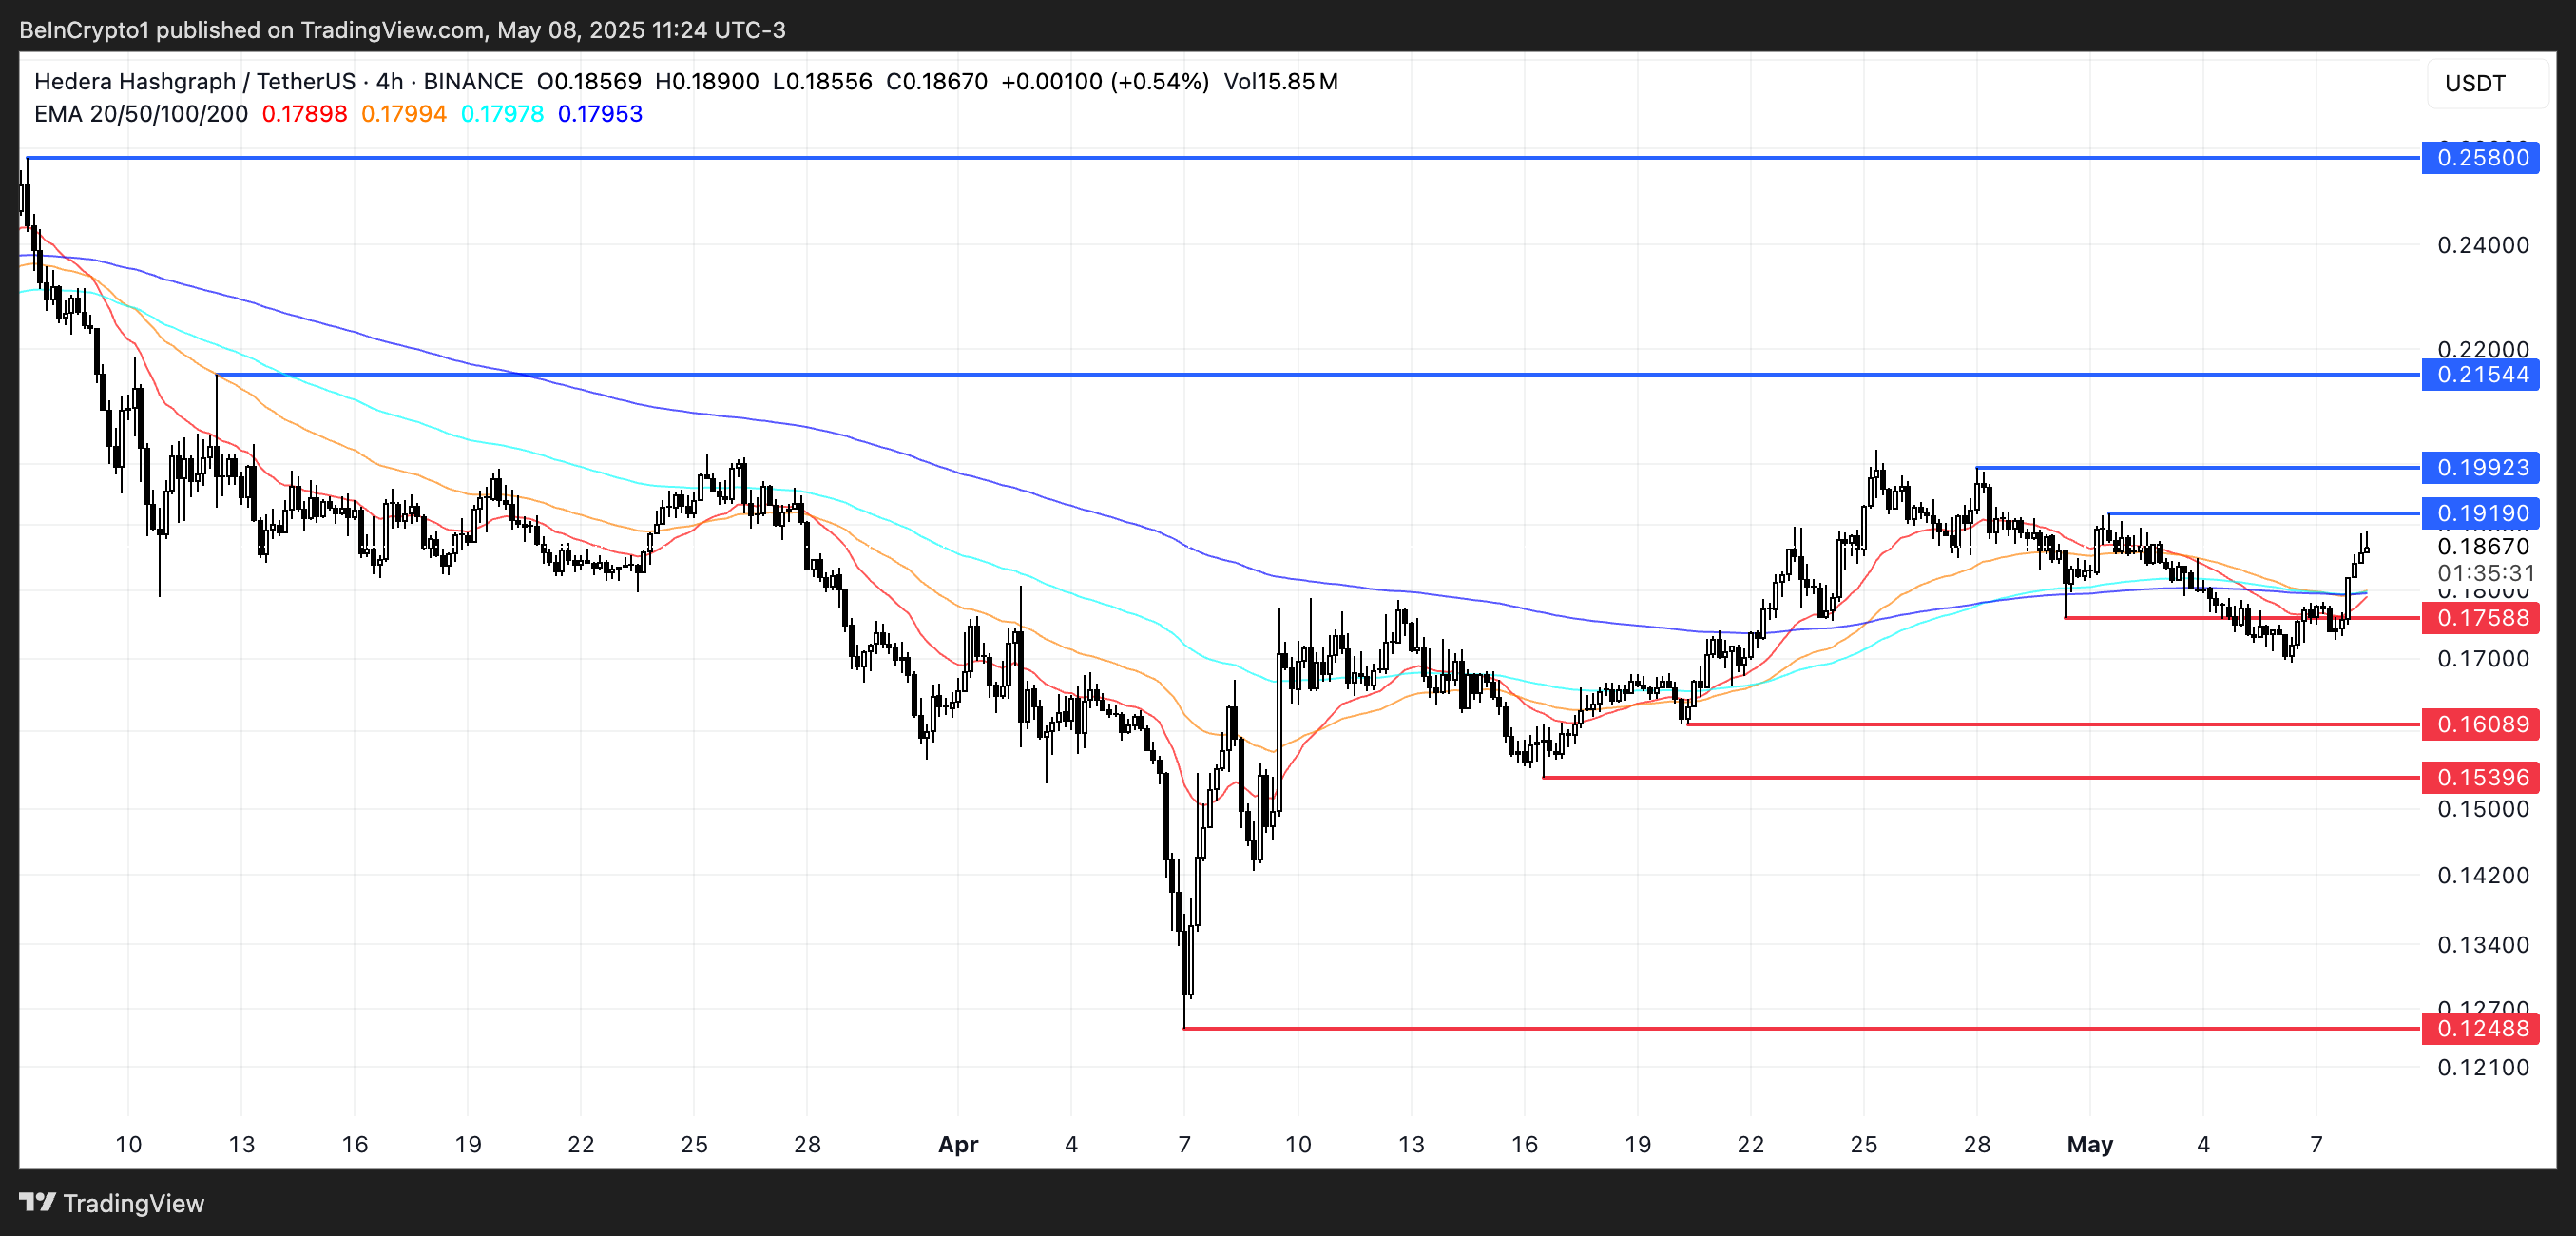
However, if HBAR fails to break through the $0.19 resistance zone, it could face a pullback.
A drop to support at $0.175 would be the first test, with deeper declines possible toward $0.160 and $0.153 if selling pressure intensifies.
HBAR could fall as low as $0.124 in a strong downtrend, marking a possible 33% correction.
Disclaimer
In line with the Trust Project guidelines, this price analysis article is for informational purposes only and should not be considered financial or investment advice. BeInCrypto is committed to accurate, unbiased reporting, but market conditions are subject to change without notice. Always conduct your own research and consult with a professional before making any financial decisions. Please note that our Terms and Conditions, Privacy Policy, and Disclaimers have been updated.