


Pi Network (PI) has seen a sharp decline of nearly 43% over the past four days after reaching levels close to $3. Despite the recent drop, technical indicators suggest that the downtrend may be losing momentum, with both the DMI and BBTrend showing signs of stabilization.
If bullish pressure returns, PI could attempt to break above key resistance levels, potentially setting the stage for a move toward $3. However, if selling pressure intensifies, PI could fall below $1.50 and test lower ranges.
Pi Network DMI Shows the Downtrend Is Losing Steam
Pi Network’s trend strength has sharply declined, as reflected in its Directional Movement Index (DMI).
The Average Directional Index (ADX), which measures the strength of a trend, dropped from 37.5 yesterday to 16, indicating that the prior downtrend has significantly weakened.
The ADX does not indicate direction but rather the intensity of a trend, with values above 25 suggesting a strong trend and anything below 20 pointing to weak or indecisive price action. With the ADX at 16, PI is currently in a phase where momentum is fading, suggesting that neither buyers nor sellers have firm control.
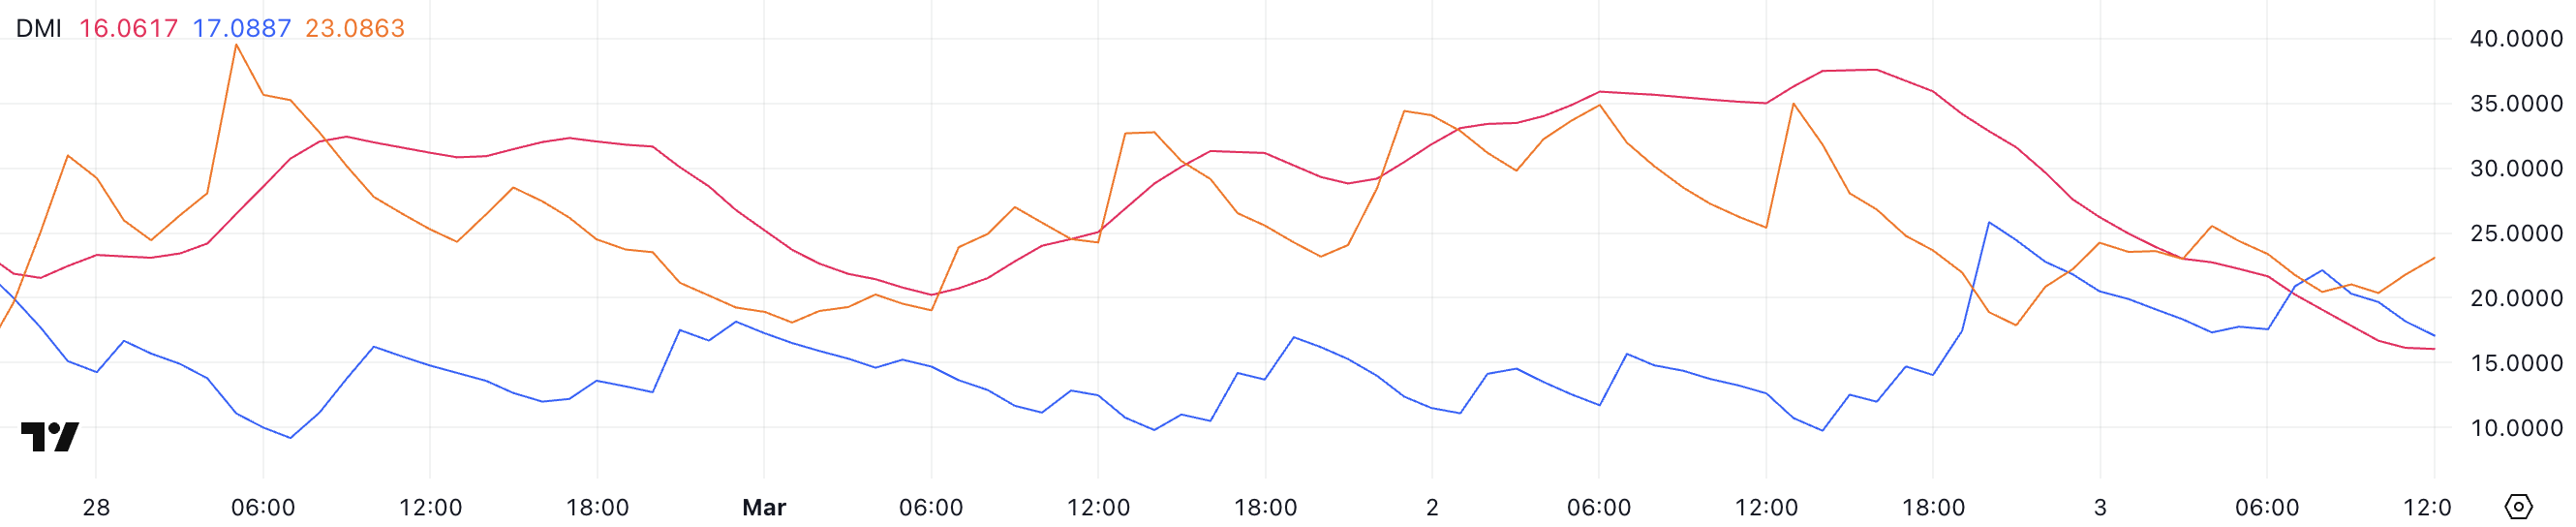
Alongside this, PI’s +DI (positive directional index) has declined from 25.8 to 17, signaling a weakening bullish force. In contrast, the -DI (negative directional index) has risen from 17.8 to 23, reflecting an increase in selling pressure.
This shift indicates that PI is still in a downtrend, though not a particularly strong one, as the ADX suggests low trend strength overall. If -DI continues to rise while ADX stays below 20, PI could remain in a sluggish downtrend rather than a steep decline.
However, if ADX starts climbing again alongside the -DI, selling pressure could intensify, leading to a sharper drop. Conversely, if buyers step in and push +DI back above -DI, PI could stabilize and potentially enter a consolidation phase.
PI BBTrend Is Still Negative, But Recovering From Recent Lows
Pi Network has been in a prolonged downtrend, as indicated by its BBTrend indicator, which has remained negative since February 28.
Yesterday, PI’s BBTrend hit a negative peak of -27.9, signaling intense selling pressure before recovering to its current level of -6.6. The BBTrend, derived from Bollinger Bands, is a volatility-based indicator that helps measure the strength and direction of a trend.
Readings above zero suggest a bullish trend, while negative values indicate bearish momentum. When BBTrend falls below -10, it often signals a heavily oversold condition, while a rise back toward neutral territory suggests a potential slowdown in selling pressure.
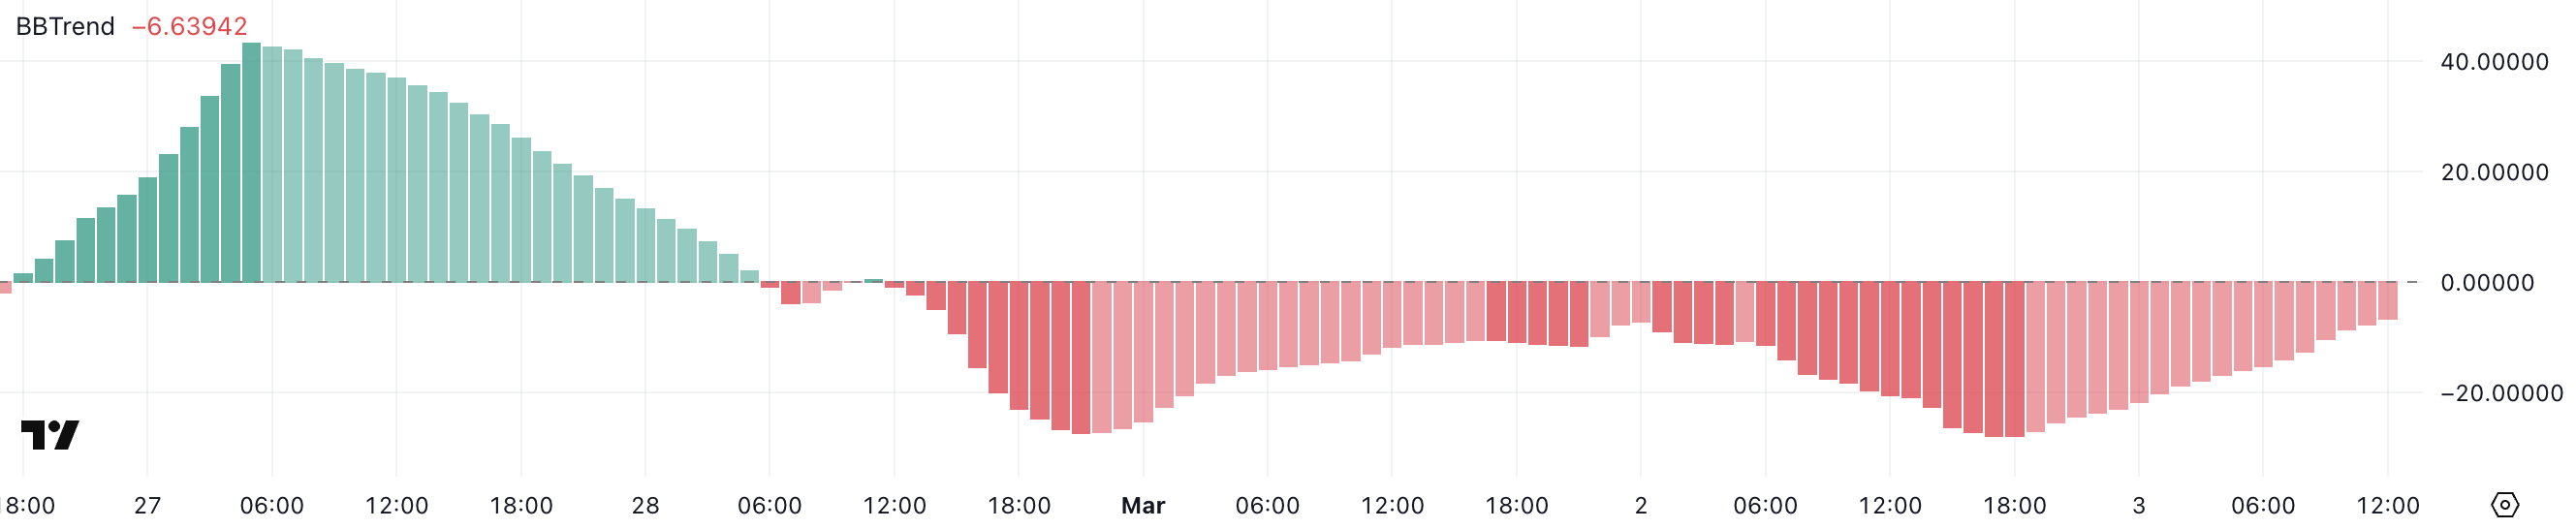
Although PI’s BBTrend is still negative at -6.6, it has improved significantly from yesterday’s extreme low, indicating that selling pressure is easing.
This suggests that the market could be stabilizing, though PI is not yet in bullish territory. If BBTrend continues rising and moves closer to zero, it could indicate a potential trend reversal or at least a period of consolidation before the next move.
However, if BBTrend turns back down and fails to recover, PI could face renewed downside pressure, making it crucial to watch whether the recent improvement sustains or fades.
Pi Network Could Rise To Test $3 In March
Pi Network has dropped nearly 43% over the past four days after reaching levels close to $3, signaling a sharp reversal from its recent highs, with an 18% decline one day ago when Vietnam authorities issued legal warnings.
If the trend shifts back to the upside, the first key resistance to watch is at $1.80. A breakout above this level could indicate renewed buying interest, potentially driving PI toward $2.35.
If bullish momentum strengthens and mirrors the surge from a few days ago, PI could rally further to $2.97, with a chance of breaking above $3 for the first time.
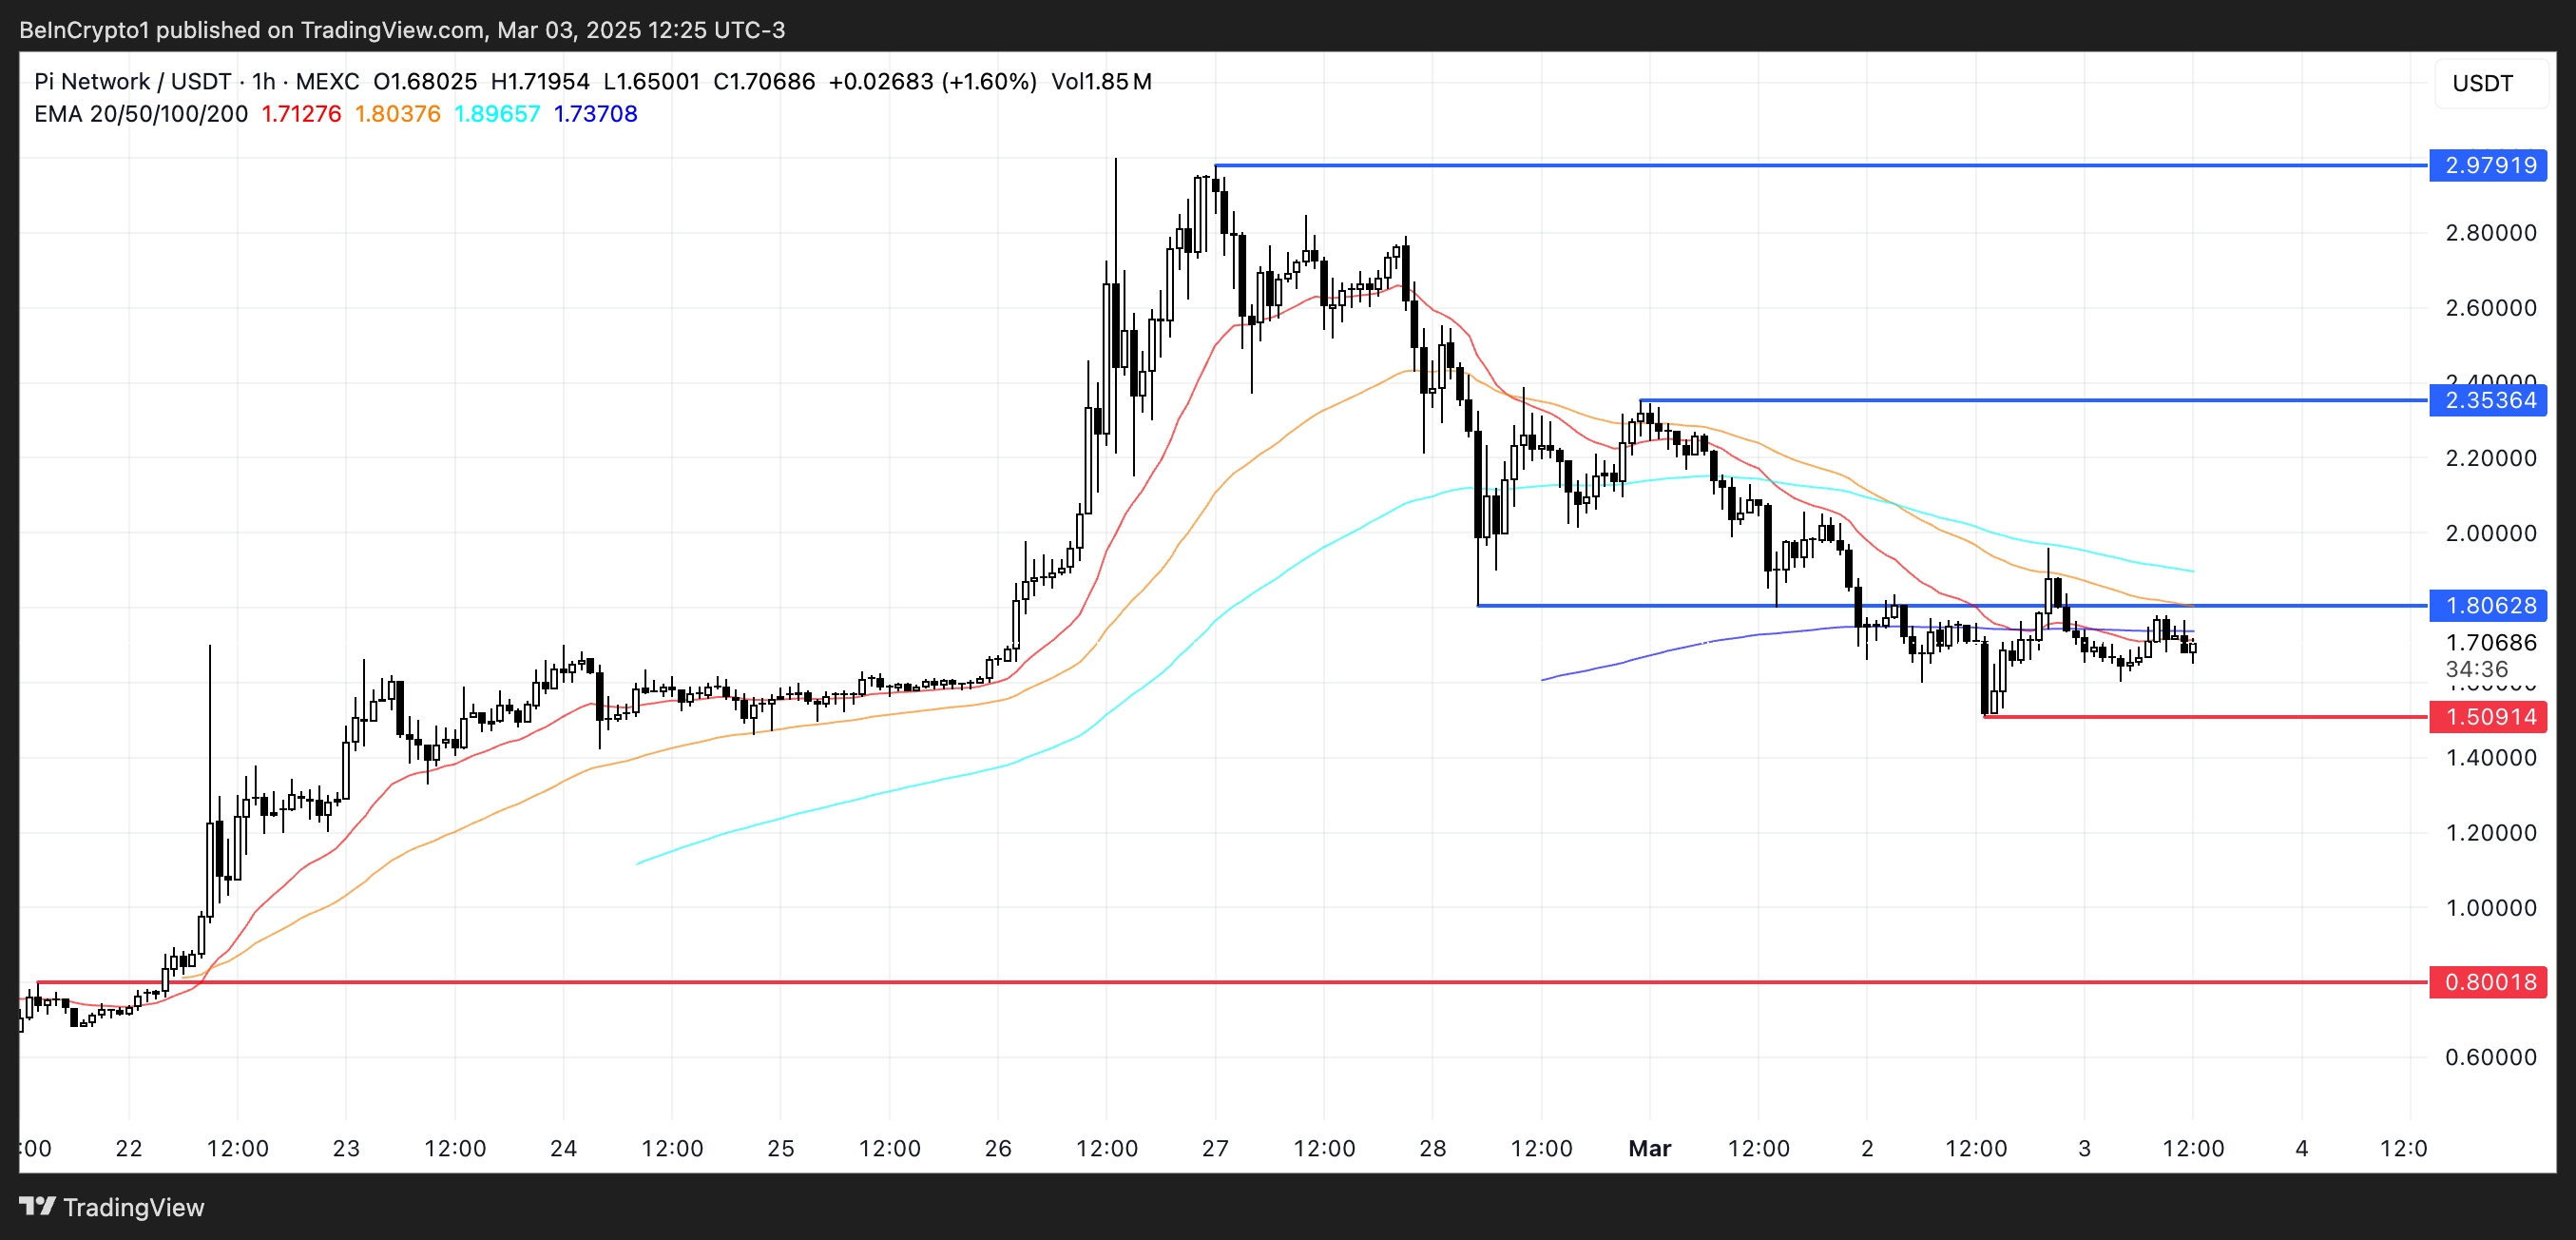
However, this scenario depends on whether buyers step in to regain control and push the price above these resistance levels.
On the downside, if selling pressure intensifies and the downtrend resumes, PI could test the $1.50 support level.
A break below this zone would expose PI to further declines, with $0.80 emerging as the next major support. Such a move would indicate that bearish momentum remains strong, possibly leading to an extended period of downside movement.
Disclaimer
In line with the Trust Project guidelines, this price analysis article is for informational purposes only and should not be considered financial or investment advice. BeInCrypto is committed to accurate, unbiased reporting, but market conditions are subject to change without notice. Always conduct your own research and consult with a professional before making any financial decisions. Please note that our Terms and Conditions, Privacy Policy, and Disclaimers have been updated.