Bubblemaps (BMT) recently saw a surge in price following the Binance Token Generation Event (TGE) and its subsequent listing. This rally sparked investor excitement, pushing the price to a new all-time high.
However, the momentum was short-lived, as many investors quickly took profits, leading to a 17% decline.
Bubblemaps Notes Selling Pressure
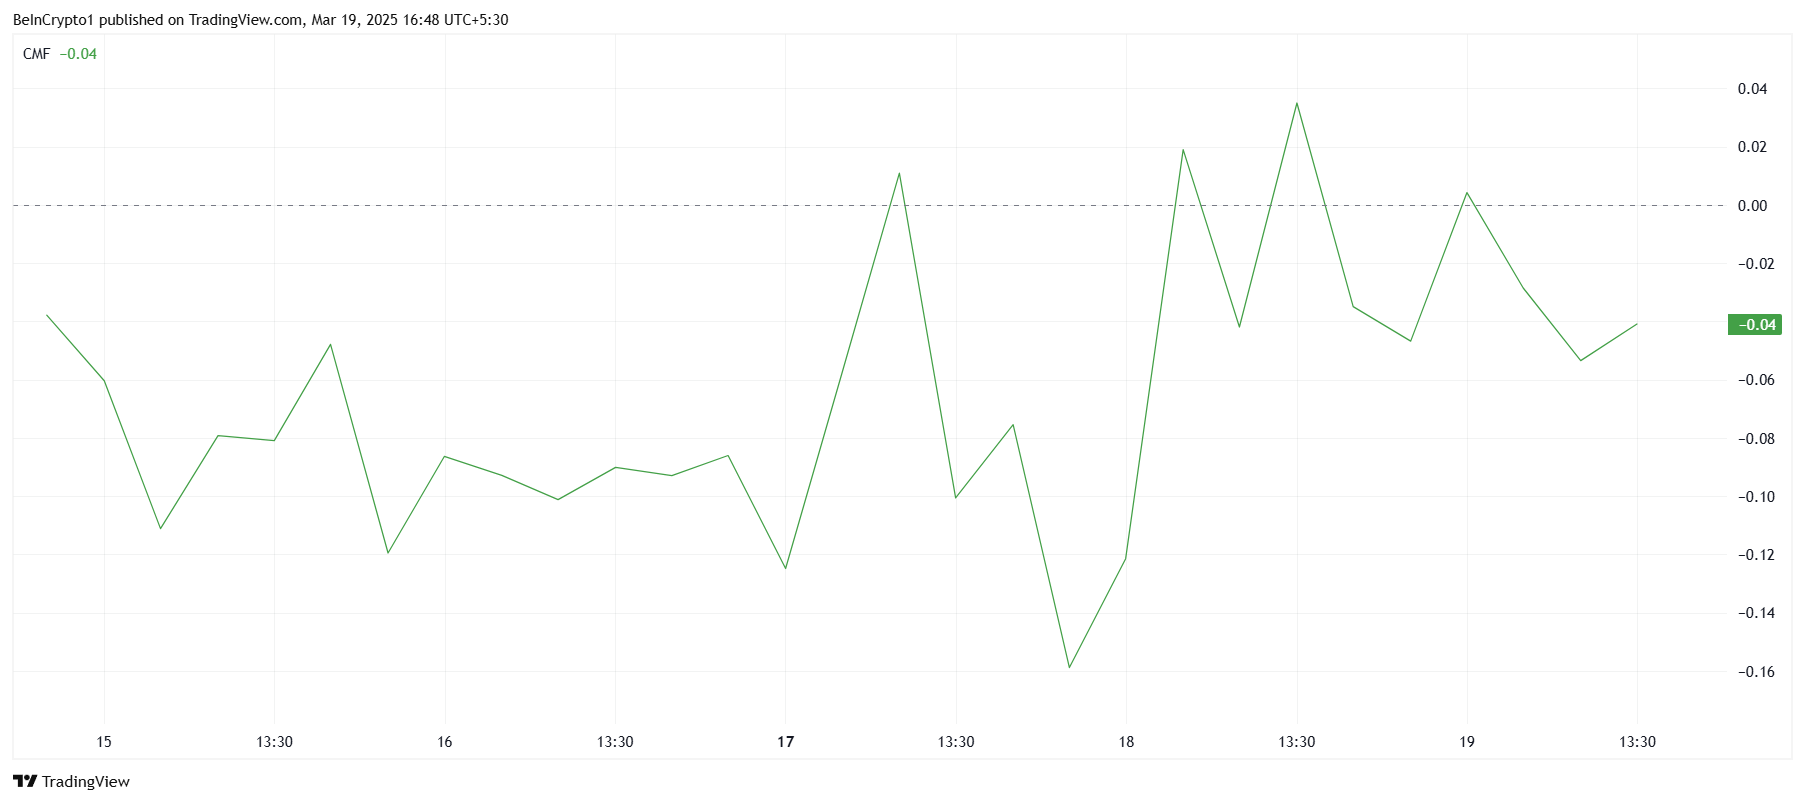
The Chaikin Money Flow (CMF) indicator showed a downtick over the last day, reflecting rising outflows as investors sell off their holdings. This drop in the CMF suggests that the momentum from the initial rally is beginning to fade.
With the indicator still struggling to move above the zero line, the lack of sustained inflows signals that the rally may lose steam in the coming days. Investors are likely cashing out after the initial excitement, which could keep BMT price from maintaining its upward trajectory.
The absence of fresh capital flowing into the asset further complicates any potential recovery.

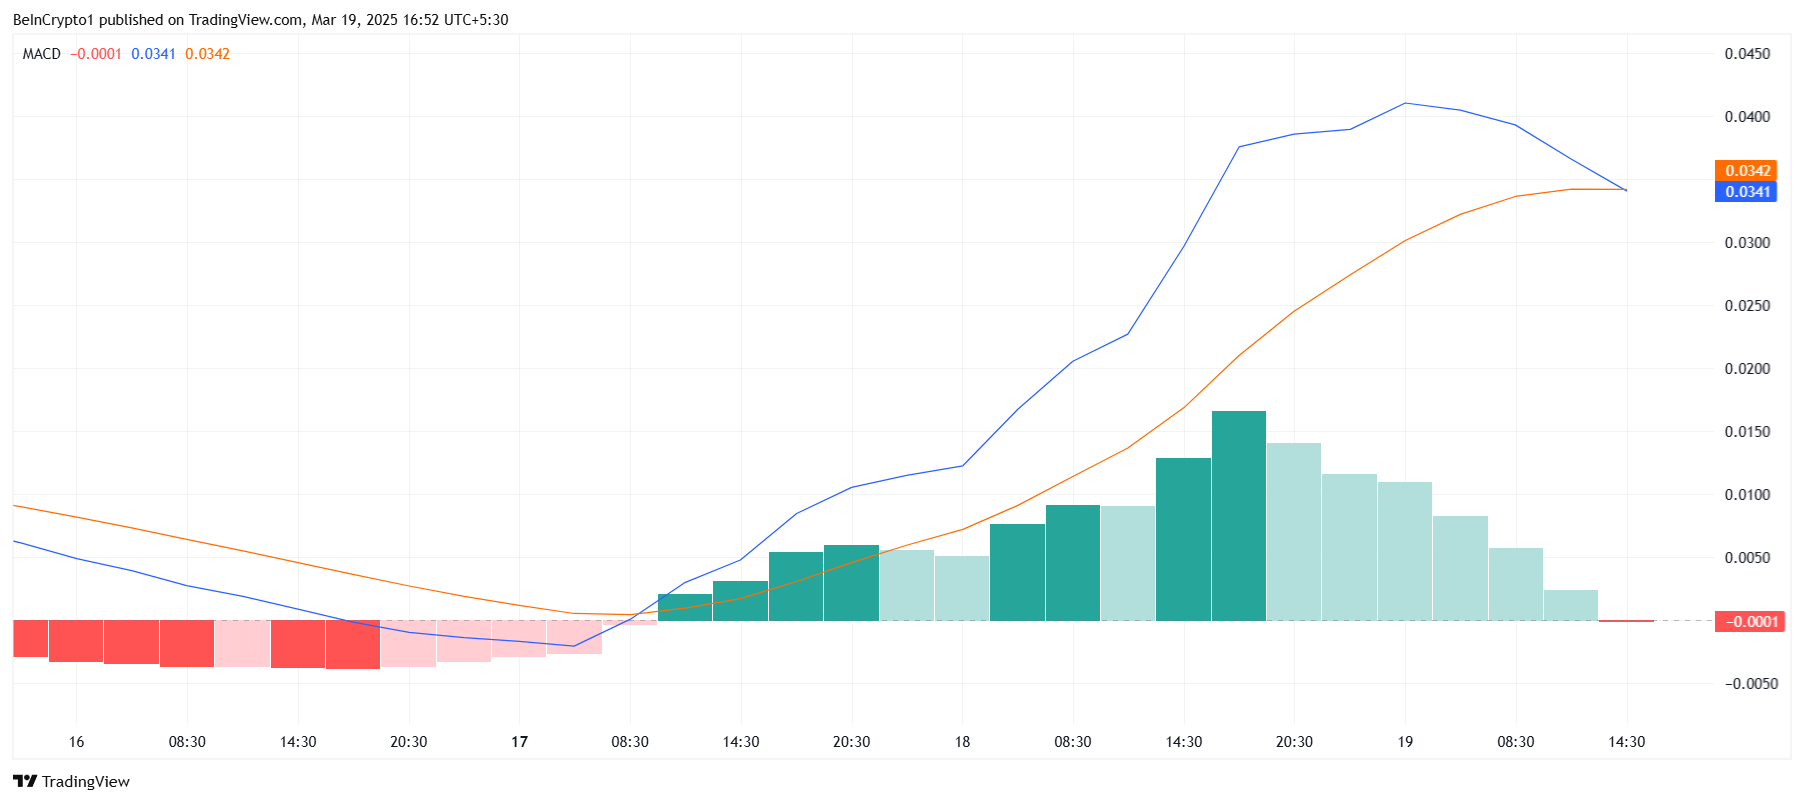
The Moving Average Convergence Divergence (MACD) indicator also points to weakening momentum. After showing positive signals earlier in the rally, the MACD has shifted towards a bearish crossover, suggesting a shift from positive to negative momentum.
The initial bullish trend appears to be losing strength, and the price could follow suit in the near term.
The MACD’s shift to bearish territory confirms that the market sentiment around Bubblemaps is starting to sour. The change in momentum is often an early sign of further declines, and this could lead to more selling as traders react to the negative signals.

BMT Price Aims For A New High
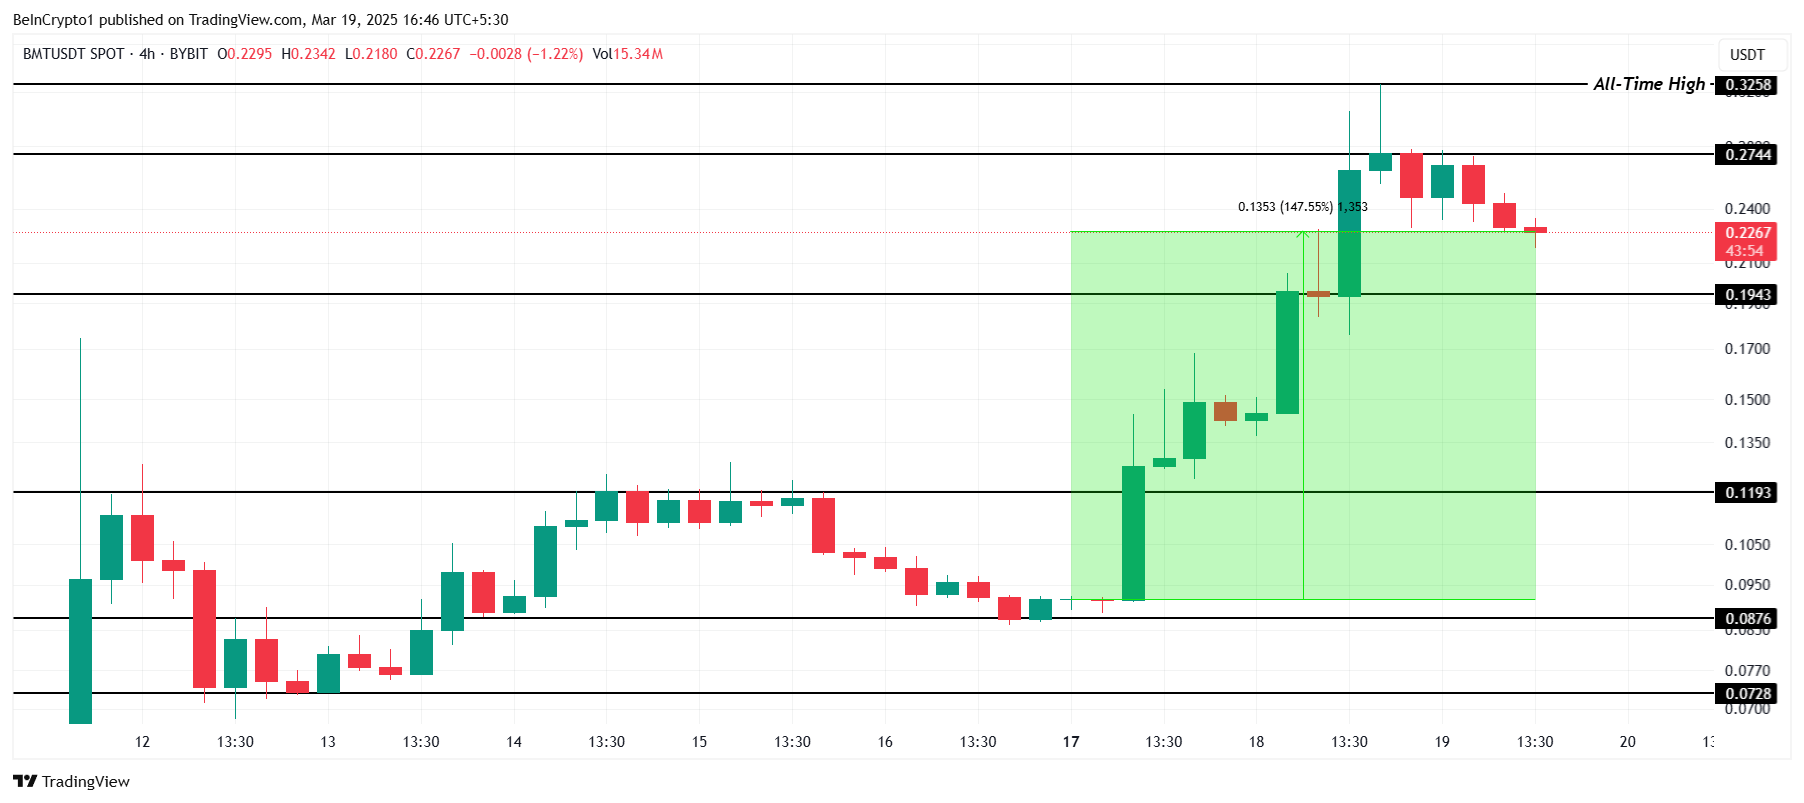
Bubblemaps has seen a significant 147% price increase over the past 48 hours. However, after the recent 17% drop, the price is now trading at $0.226. Given the current market conditions, BMT could experience further declines, potentially falling to $0.194 or even as low as $0.119 if investor sentiment continues to drop.
Should the outflows continue, Bubblemaps could struggle to recover. The lack of strong inflows and the shift in momentum from bullish to bearish will likely limit any upside.
A drop below $0.194 would solidify a bearish outlook, and the altcoin may need more substantial market support to avoid further losses.

However, if inflows pick up and buying pressure strengthens, there is potential for a price rebound. A breach of the $0.274 resistance level could pave the way for a new all-time high above $0.325, invalidating the current bearish trend and signaling renewed investor confidence.
Disclaimer
In line with the Trust Project guidelines, this price analysis article is for informational purposes only and should not be considered financial or investment advice. BeInCrypto is committed to accurate, unbiased reporting, but market conditions are subject to change without notice. Always conduct your own research and consult with a professional before making any financial decisions. Please note that our Terms and Conditions, Privacy Policy, and Disclaimers have been updated.


