

 Price Prediction 2025, 2026-2030")
- Bullish MOVE price prediction for 2025 is $0.5592 to $0.8531.
- Movement (MOVE) price might reach $2 soon.
- Bearish (MOVE) price prediction for 2025 is $0.2415.
In this Movement (MOVE) price prediction 2025, 2026-2030, we will analyze the price patterns of MOVE by using accurate trader-friendly technical analysis indicators and predict the future movement of the cryptocurrency.
|
TABLE OF CONTENTS |
|
INTRODUCTION |
|
|
Movement (MOVE) PRICE PREDICTION 2025 |
|
| Movement (MOVE) PRICE PREDICTION 2026, 2027-2030 |
| CONCLUSION |
| FAQ |
Movement (MOVE) Current Market Status
| Current Price | $0.5040 | 24 – Hour Price Change | 7.69% Up |
| 24 – Hour Trading Volume | $155.84M |
| Market Cap | $1.23B |
| Circulating Supply | 2.45B MOVE | All – Time High | $1.45 (On December 10, 2024) |
| All – Time Low | $0.3735 (On March 04, 2025) |
(Source: CoinMarketCap)
What is Movement (MOVE)
| TICKER | MOVE |
| BLOCKCHAIN | Ethereum |
| CATEGORY | Blockchain Ecosystem |
| LAUNCHED ON | December 2024 |
| UTILITIES | Governance, security, gas fees & rewards |
Movement Network is an ecosystem focused on building blockchain applications. It has built one of the first Move-EVM L2 for Ethereum. The ecosystem helps developers to launch highly-performing VM rollups easily. Additionally it also uses state-of-the-art technology tools such as Move Executor, Fast Finality Settlement Module, and Decentralized Shared Sequencer to build Move-based blockchains.
The Movement token was launched in December 2024 and has seen significant investor interest over the past months. Amid leading altcoins such as XRP and Chainlink, Movement has also garnered market attention recently.
Movement 24H Technicals
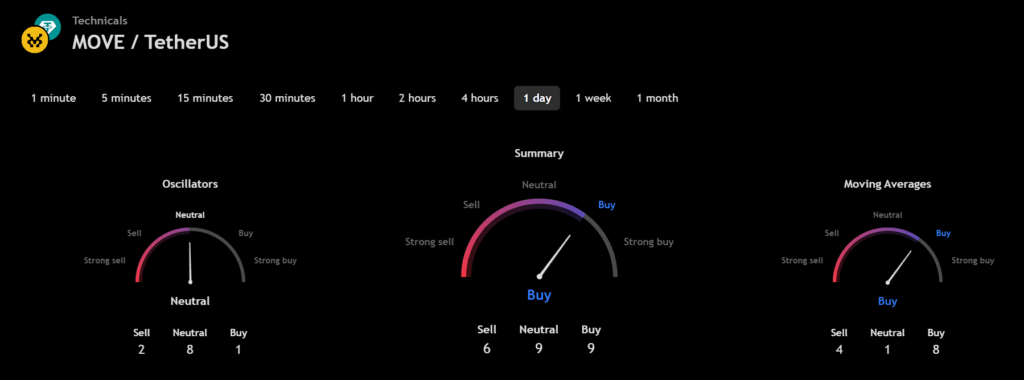
(Source: TradingView)
Movement (MOVE) Price Prediction 2025
Movement (MOVE) ranks 62nd on CoinMarketCap in terms of its market capitalization. The overview of the Movement price prediction for 2025 is explained below with a daily time frame.
MOVE/USDT Horizontal Channel Pattern (Source: TradingView)
In the above chart, Movement (MOVE) is laid out as a horizontal channel pattern. A horizontal channel or sideways trend has the appearance of a rectangle pattern. It consists of at least four contract points. This is because it needs at least two lows to connect, as well as two highs. Horizontal channels provide a clear and systematic way to trade by providing buy and sell points. The longer the horizontal channel, the stronger the exit movement will be. There is frequently a price on the channel after exit. The exit often occurs at the fourth contact point on one of the horizontal channel’s lines.
At the time of analysis, Movement’s (MOVE) price was $0.5040. If the pattern trend continues, then the price of MOVE might reach the resistance levels of $0.5091, $0.6387, and $1.0134. If the trend reverses, then the price of MOVE may fall to the support of $0.4050.
Movement (MOVE) Resistance and Support Levels
The chart given below elucidates the possible resistance and support levels of Movement (MOVE) in 2025.
MOVE/USDT Resistance and Support Levels (Source: TradingView)
From the above chart, we can analyze and identify the following as resistance and support levels of Movement (MOVE) for 2025.
| Resistance Level 1 | $0.5592 |
| Resistance Level 2 | $0.8531 |
| Support Level 1 | $0.3662 |
| Support Level 2 | $0.2415 |
MOVE Resistance & Support Levels
Movement (MOVE) Price Prediction 2025 — RVOL, MA, and RSI
The technical analysis indicators such as Relative Volume (RVOL), Moving Average (MA), and Relative Strength Index (RSI) of Movement (MOVE) are shown in the chart below.
MOVE/USDT RVOL, MA, RSI (Source: TradingView)
From the readings on the chart above, we can make the following inferences regarding the current Movement (MOVE) market in 2025.
| INDICATOR | PURPOSE | READING | INFERENCE |
| 50-Day Moving Average (50MA) | Nature of the current trend by comparing the average price over 50 days | 50 MA = $0.4859Price = $0.4974 (50MA < Price) |
Bullish/Uptrend |
| Relative Strength Index (RSI) | Magnitude of price change;Analyzing oversold & overbought conditions | 52.4144 <30 = Oversold 50-70 = Neutral>70 = Overbought |
Neutral |
| Relative Volume (RVOL) | Asset’s trading volume in relation to its recent average volumes | Below cutoff line | Weak Volume |
Movement (MOVE) Price Prediction 2025 — ADX, RVI
In the below chart, we analyze the strength and volatility of Movement (MOVE) using the following technical analysis indicators — Average Directional Index (ADX) and Relative Volatility Index (RVI).
MOVE/USDT ADX, RVI (Source: TradingView)
From the readings on the chart above, we can make the following inferences regarding the price momentum of Movement (MOVE).
| INDICATOR | PURPOSE | READING | INFERENCE |
| Average Directional Index (ADX) | Strength of the trend momentum | 56.0332 | Strong Trend |
| Relative Volatility Index (RVI) | Volatility over a specific period | 48.74 <50 = Low >50 = High |
Low Volatility |
Comparison of MOVE with BTC, ETH
Let us now compare the price movements of Movement (MOVE) with that of Bitcoin (BTC), and Ethereum (ETH).
BTC Vs ETH Vs MOVE Price Comparison (Source: TradingView)
From the above chart, we can interpret that the price action of MOVE is dissimilar to that of BTC and ETH. That is, when the price of BTC and ETH increases, the price of MOVE decreases, if the price of BTC and ETH decreases, the price of MOVE increases. .
Movement (MOVE) Price Prediction 2026, 2027 – 2030
With the help of the aforementioned technical analysis indicators and trend patterns, let us predict the price of Movement (MOVE) between 2026, 2027, 2028, 2029, and 2030.
| Year | Bullish Price | Bearish Price |
| Movement (MOVE) Price Prediction 2026 | $3 | $0.2 |
| Movement (MOVE) Price Prediction 2027 | $4 | $0.1 |
| Movement (MOVE) Price Prediction 2028 | $5 | $0.09 |
| Movement (MOVE) Price Prediction 2029 | $6 | $0.08 |
| Movement (MOVE) Price Prediction 2030 | $7 | $0.07 |
Conclusion
If Movement (MOVE) establishes itself as a good investment in 2025, this year would be favorable to the cryptocurrency. In conclusion, the bullish Movement (MOVE) price prediction for 2025 is $0.8531. Comparatively, if unfavorable sentiment is triggered, the bearish Movement (MOVE) price prediction for 2025 is $0.2415.
If the market momentum and investors’ sentiment positively elevate, then Movement (MOVE) might hit $2. Furthermore, with future upgrades and advancements in the Movement ecosystem, MOVE might surpass its current all-time high (ATH) of $1.45 and mark its new ATH.
FAQ
1. What is Movement (MOVE)?
Movement is the utility token of Movement Network, an Ethereum-based L2 blockchain builder.
2. Where can you buy Movement (MOVE)?
Traders can trade Movement (MOVE) on the following cryptocurrency exchanges such as Binance, MEXC and Bitget.
3. Will Movement (MOVE) record a new ATH soon?
With the ongoing developments and upgrades within the Movement platform, Movement (MOVE) has a high possibility of reaching its ATH soon.
4. What is the current all-time high (ATH) of Movement (MOVE)?
Movement (MOVE) hit its current all-time high (ATH) of $1.45 on December 10, 2024.
5. What is the lowest price of Movement (MOVE)?
According to CoinMarketCap, MOVE hit its all-time low (ATL) of $0.3735 on March 04, 2025.
6. Will Movement (MOVE) hit $2?
If Movement (MOVE) becomes one of the active cryptocurrencies that majorly maintain a bullish trend, it might rally to hit $2 soon.
7. What will be the Movement (MOVE) price by 2025?
Movement (MOVE) price might reach $3 by 2025.
8. What will be the Movement (MOVE) price by 2026?
Movement (MOVE) price might reach $4 by 2026.
9. What will be the Movement (MOVE) price by 2027?
Movement (MOVE) price might reach $5 by 2027.
10. What will be the Movement (MOVE) price by 2028?
Movement (MOVE) price might reach $6 by 2028.
Top Crypto Predictions
Ethereum Name Service (ENS) Price Prediction
Disclaimer: The opinion expressed in this chart is solely the author’s. It does not represent any investment advice. TheNewsCrypto team encourages all to do their own research before investing.