


After reaching a local cycle high of $0.049 in January, XCN entered a downtrend, shedding significant value over the next few months. The decline culminated in a sharp drop to a low of $0.007 on April 7. However, that marked a turning point.
Since then, the demand for the altcoin has soared, pushing its price up 171%. With growing bullish momentum, XCN appears poised to extend these gains.
XCN Breaks Out With Bullish Momentum
Since bottoming out, XCN has rebounded strongly, breaking above a key descending resistance trend line. The breakout triggered a bullish move that has pushed the altcoin to record significant gains over the past week.
On the daily chart, XCN’s Balance of Power (BoP) supports the ongoing rally. At press time, this momentum indicator, which measures buying and selling pressures, is above zero at 0.24.
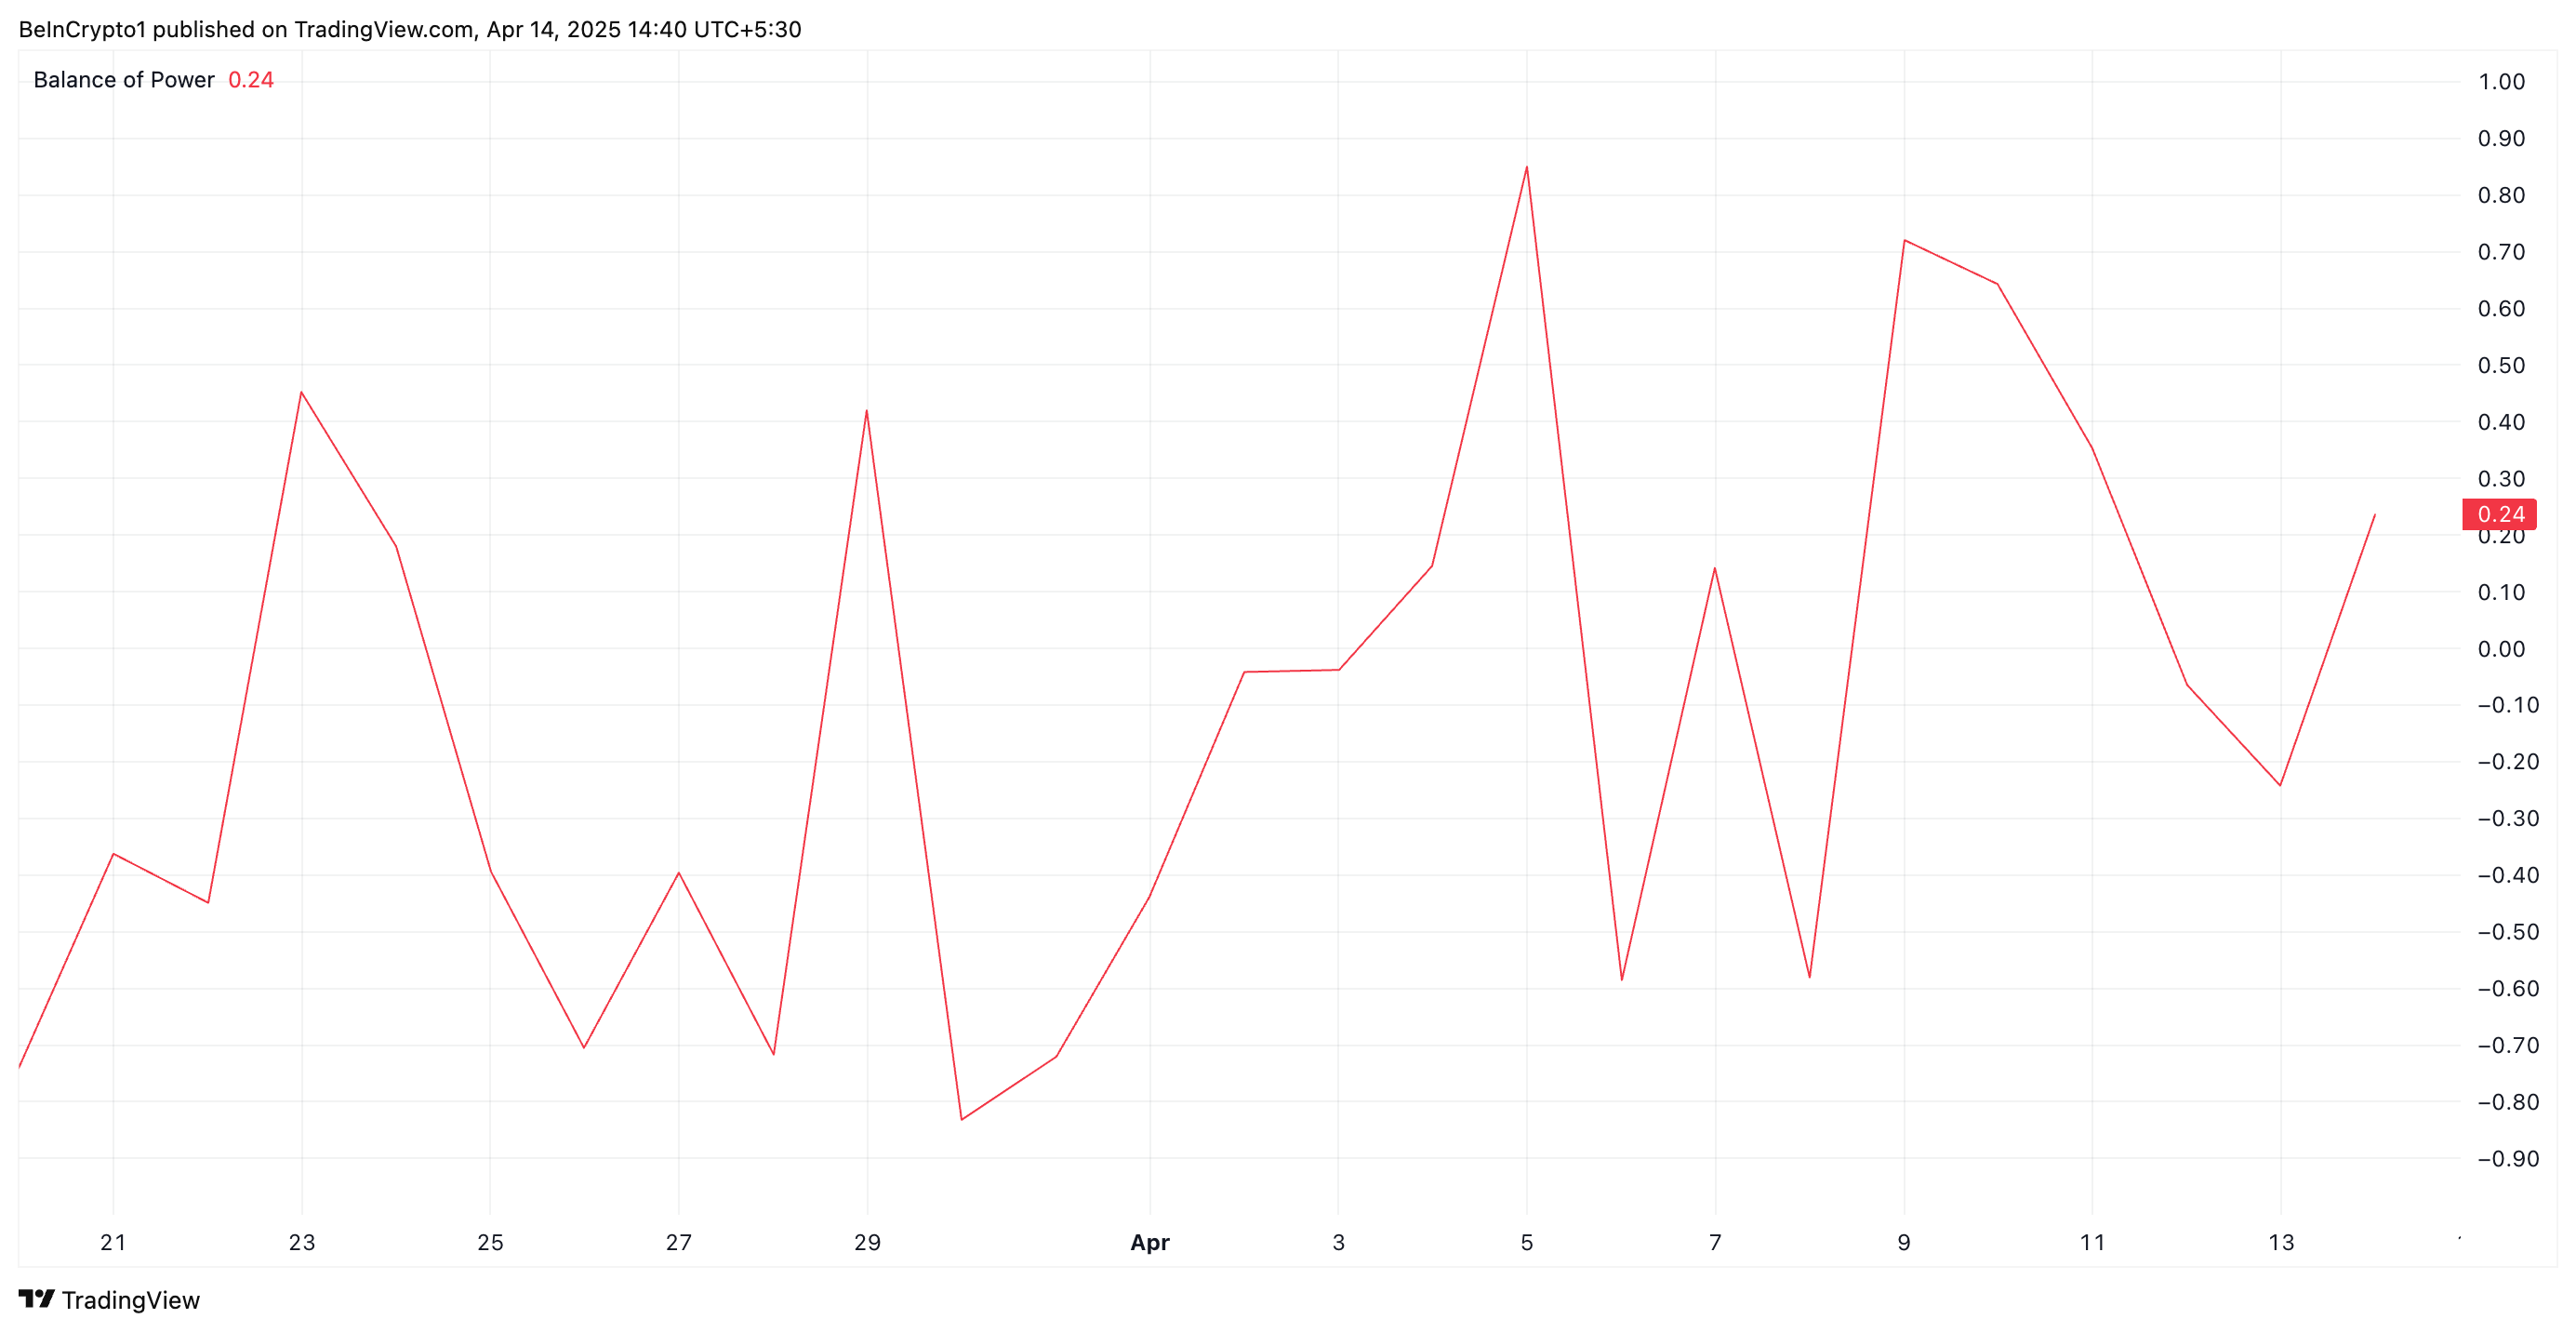
When an asset’s BoP is positive, it indicates that buyers are in control of the market, exerting more pressure than sellers. This is a bullish sign, suggesting that XCN’s upward price movement is being driven by strong demand.
A consistently positive BoP for the token would indicate sustained buying momentum, which, if maintained, could lead to continued price growth.
However, XCN’s derivatives traders do not share this bullish bias. The token’s persistently negative funding rate reflects this. This stands at -0.032% at press time, highlighting the demand for short positions.
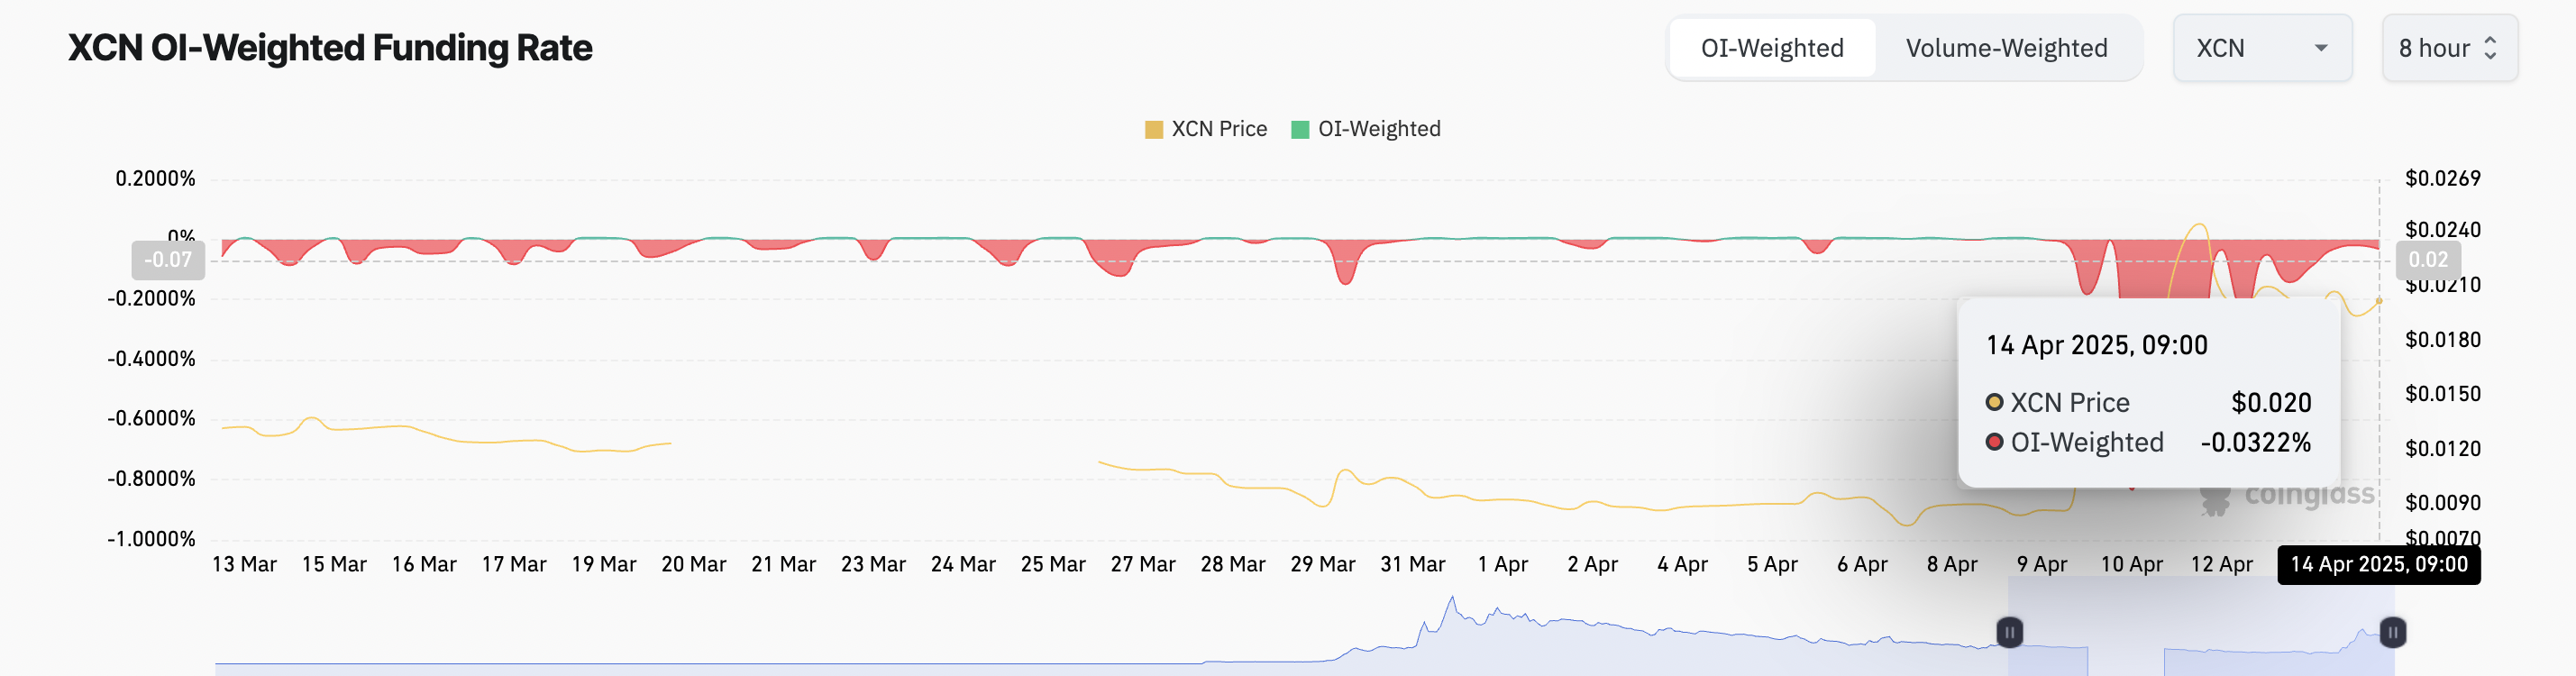
The funding rate is a periodic payment exchanged between long and short position holders in perpetual futures contracts. It is designed to keep the contract’s price in line with the asset’s spot price.
When the funding rate is negative like this, short position holders are paying long position holders, indicating that the market is bearish, with more traders betting on price declines.
XCN’s climbing buying pressure and negative funding rate signal a divergence between spot market sentiment and derivatives market positioning. This trend suggests that while the broader derivatives market expects a price decline, actual buying activity on the spot market is driving upward momentum, setting the stage for a short squeeze if the rally continues.
XCN Price Pushes Past 20-Day EMA, Traders Eye Continued Rally
XCN’s rally over the past week has pushed its price above the 20-day exponential moving average (EMA). The 20-day EMA measures an asset’s average trading days over the past 20 trading days, giving more weight to recent prices. When the price climbs above it, it signals that buying pressure is high.
As XCN breaks above this level, it confirms that the asset is entering an uptrend. Traders often look for this type of crossover as a sign of bullish strength, indicating increased buying pressure and a possible continuation of the rally.
If XCN maintains its uptrend, it could trade at $0.023.
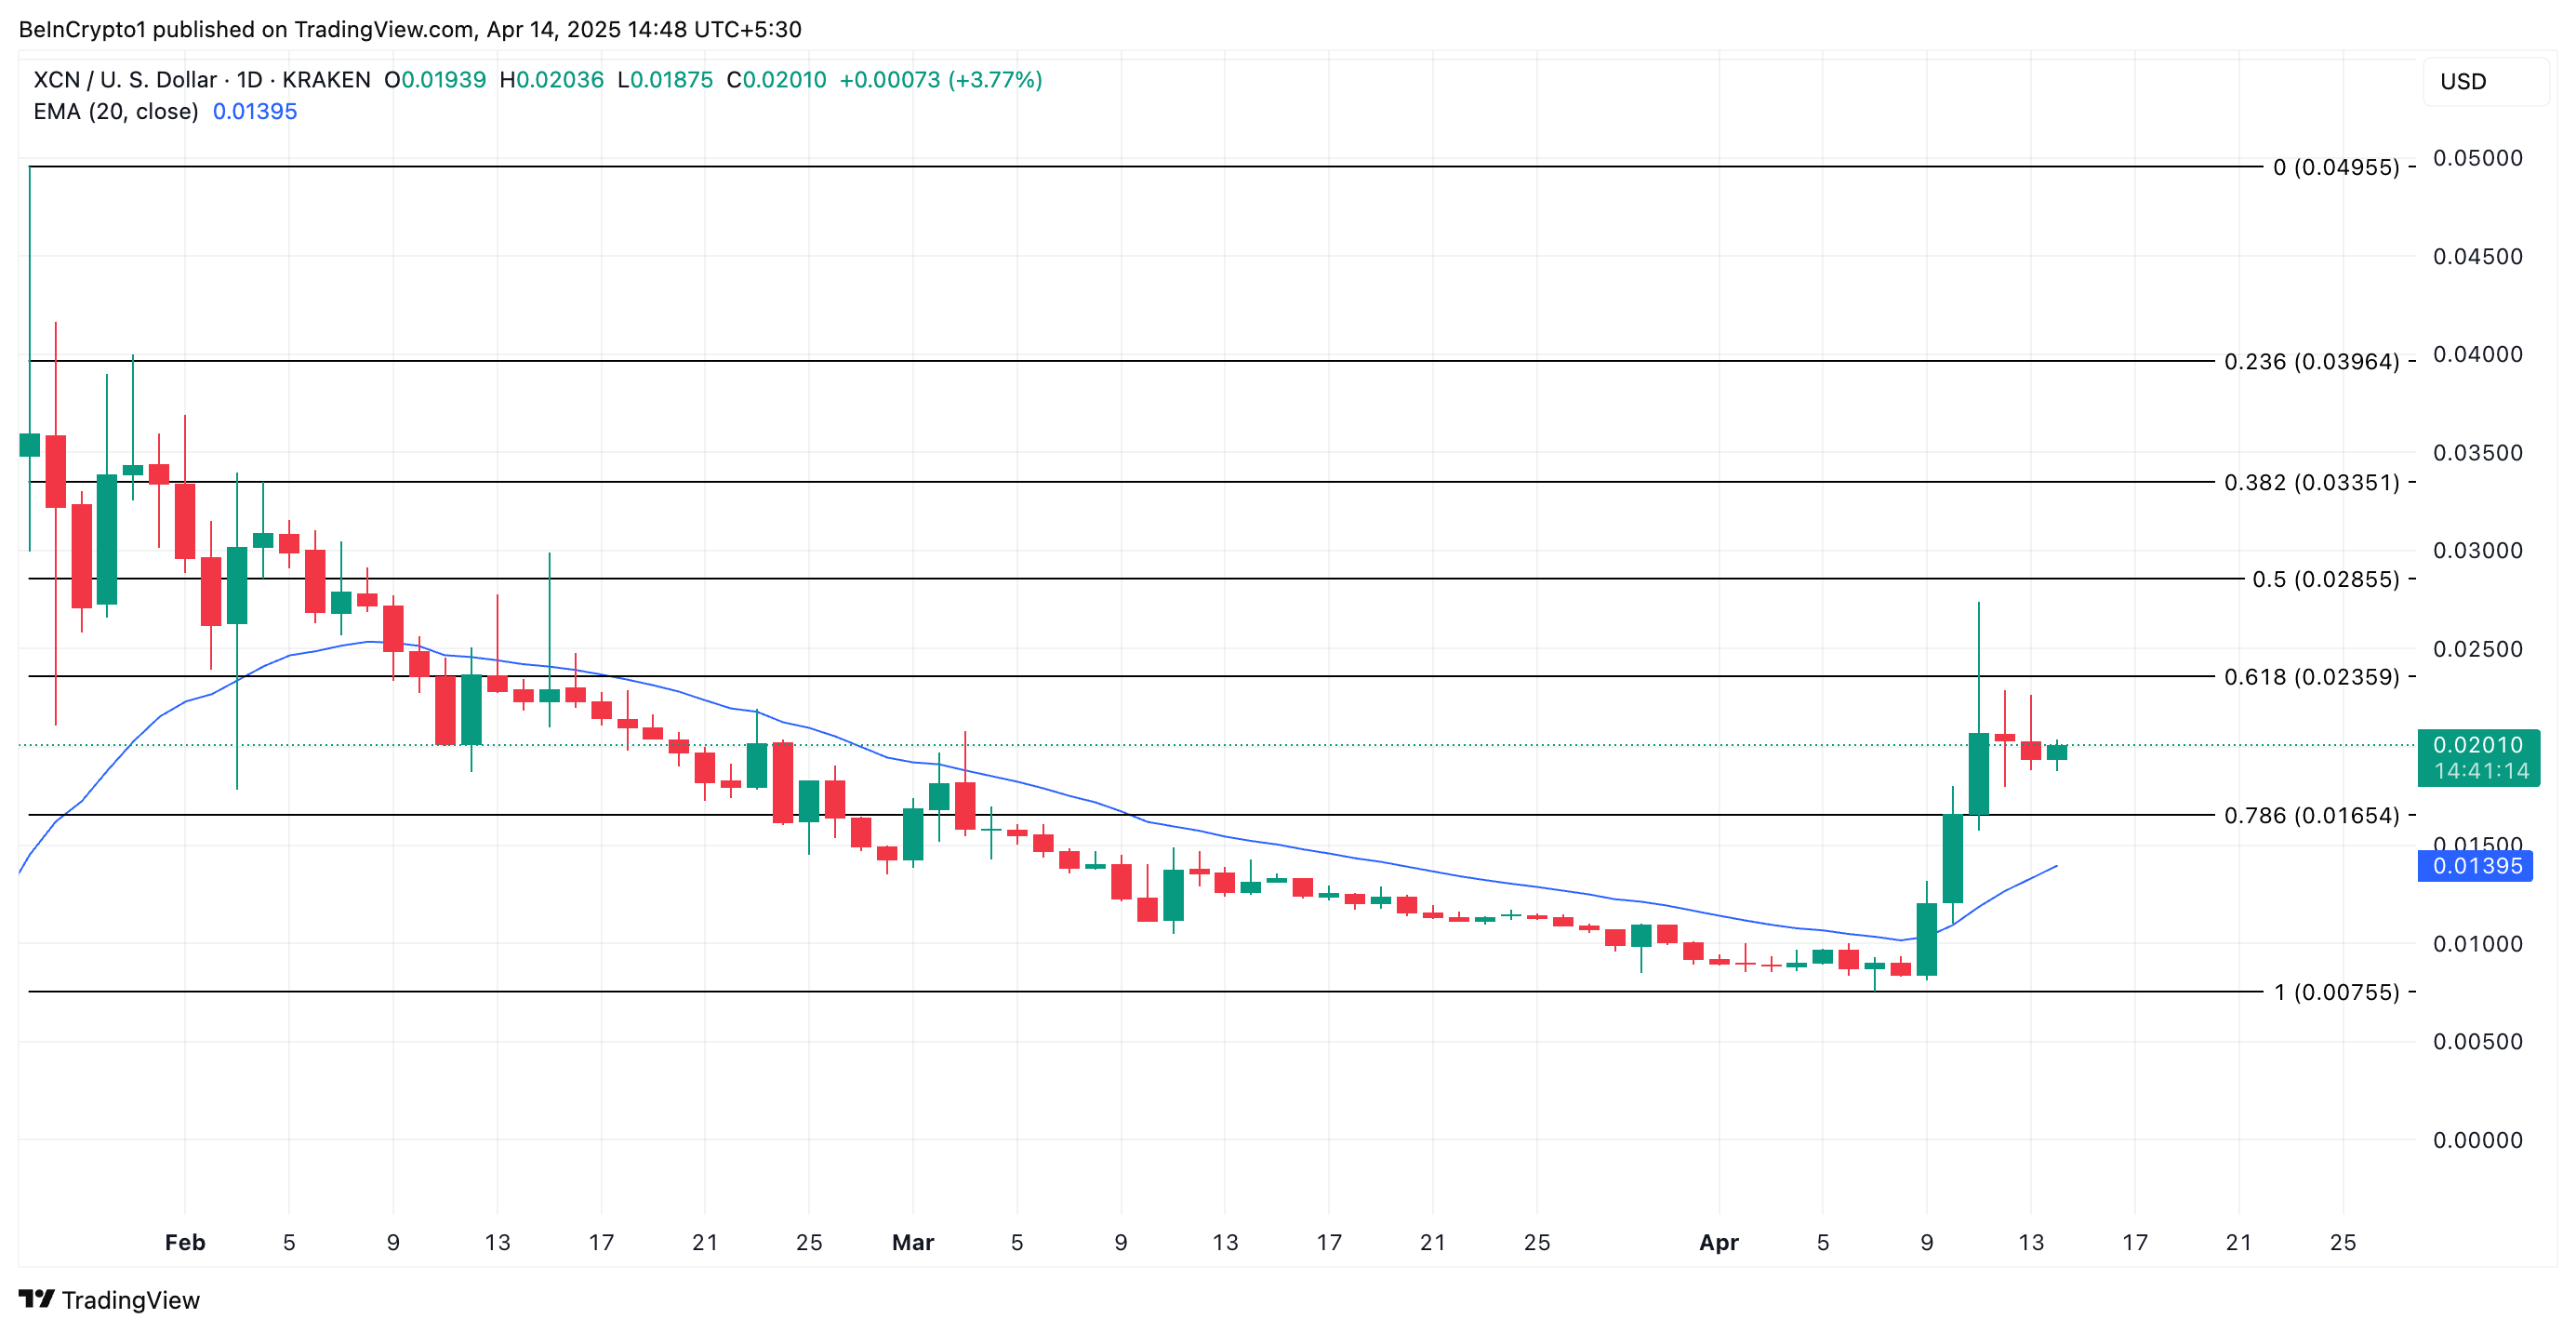
On the other hand, if the uptrend faces a correction, XNC could fall to $0.016.
Disclaimer
In line with the Trust Project guidelines, this price analysis article is for informational purposes only and should not be considered financial or investment advice. BeInCrypto is committed to accurate, unbiased reporting, but market conditions are subject to change without notice. Always conduct your own research and consult with a professional before making any financial decisions. Please note that our Terms and Conditions, Privacy Policy, and Disclaimers have been updated.